Directional Movement System
Definition
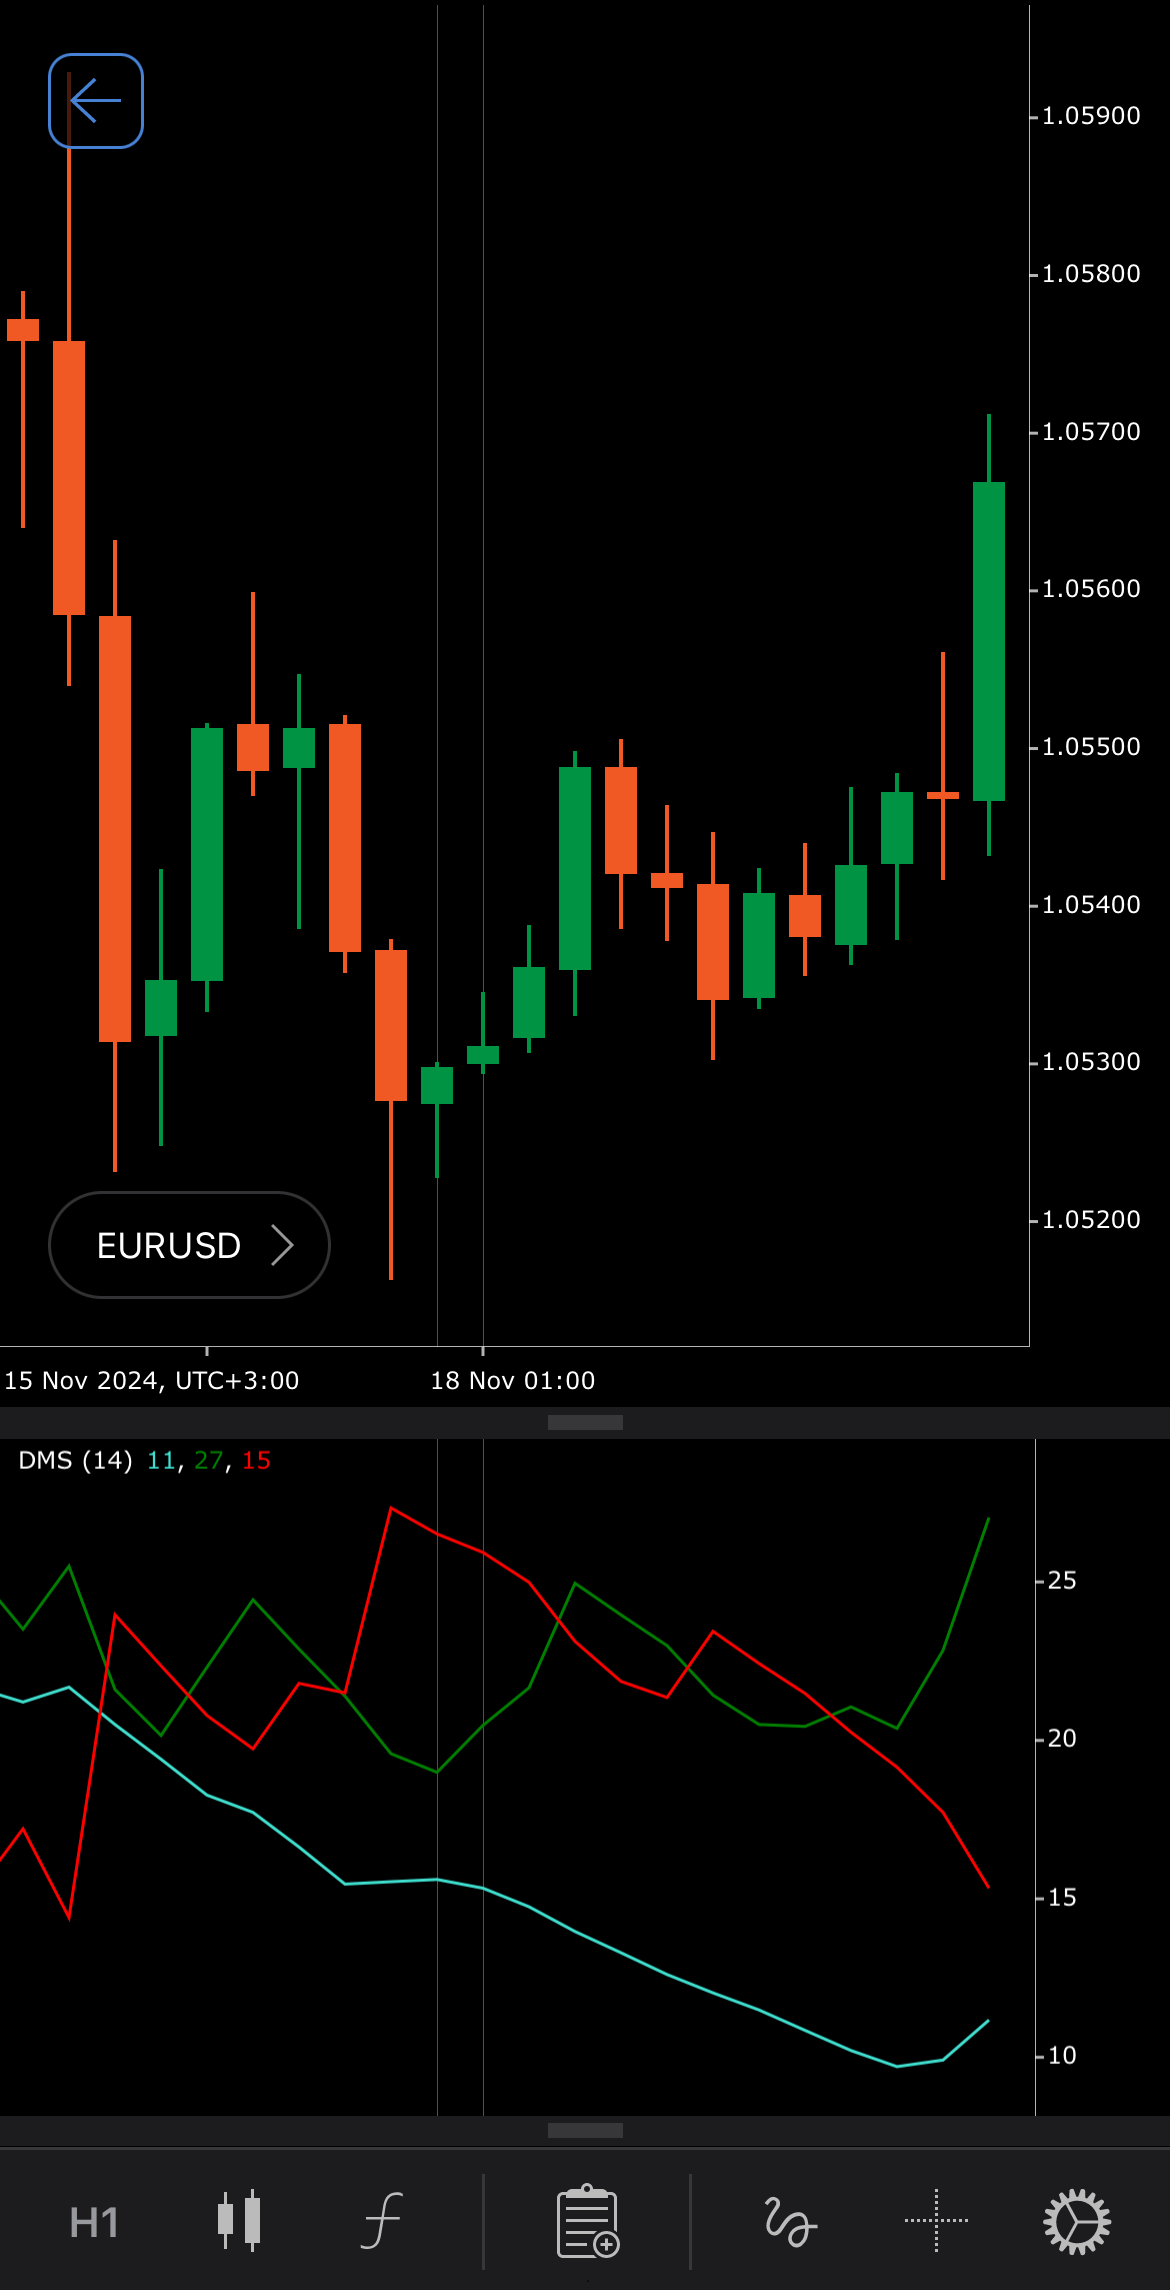
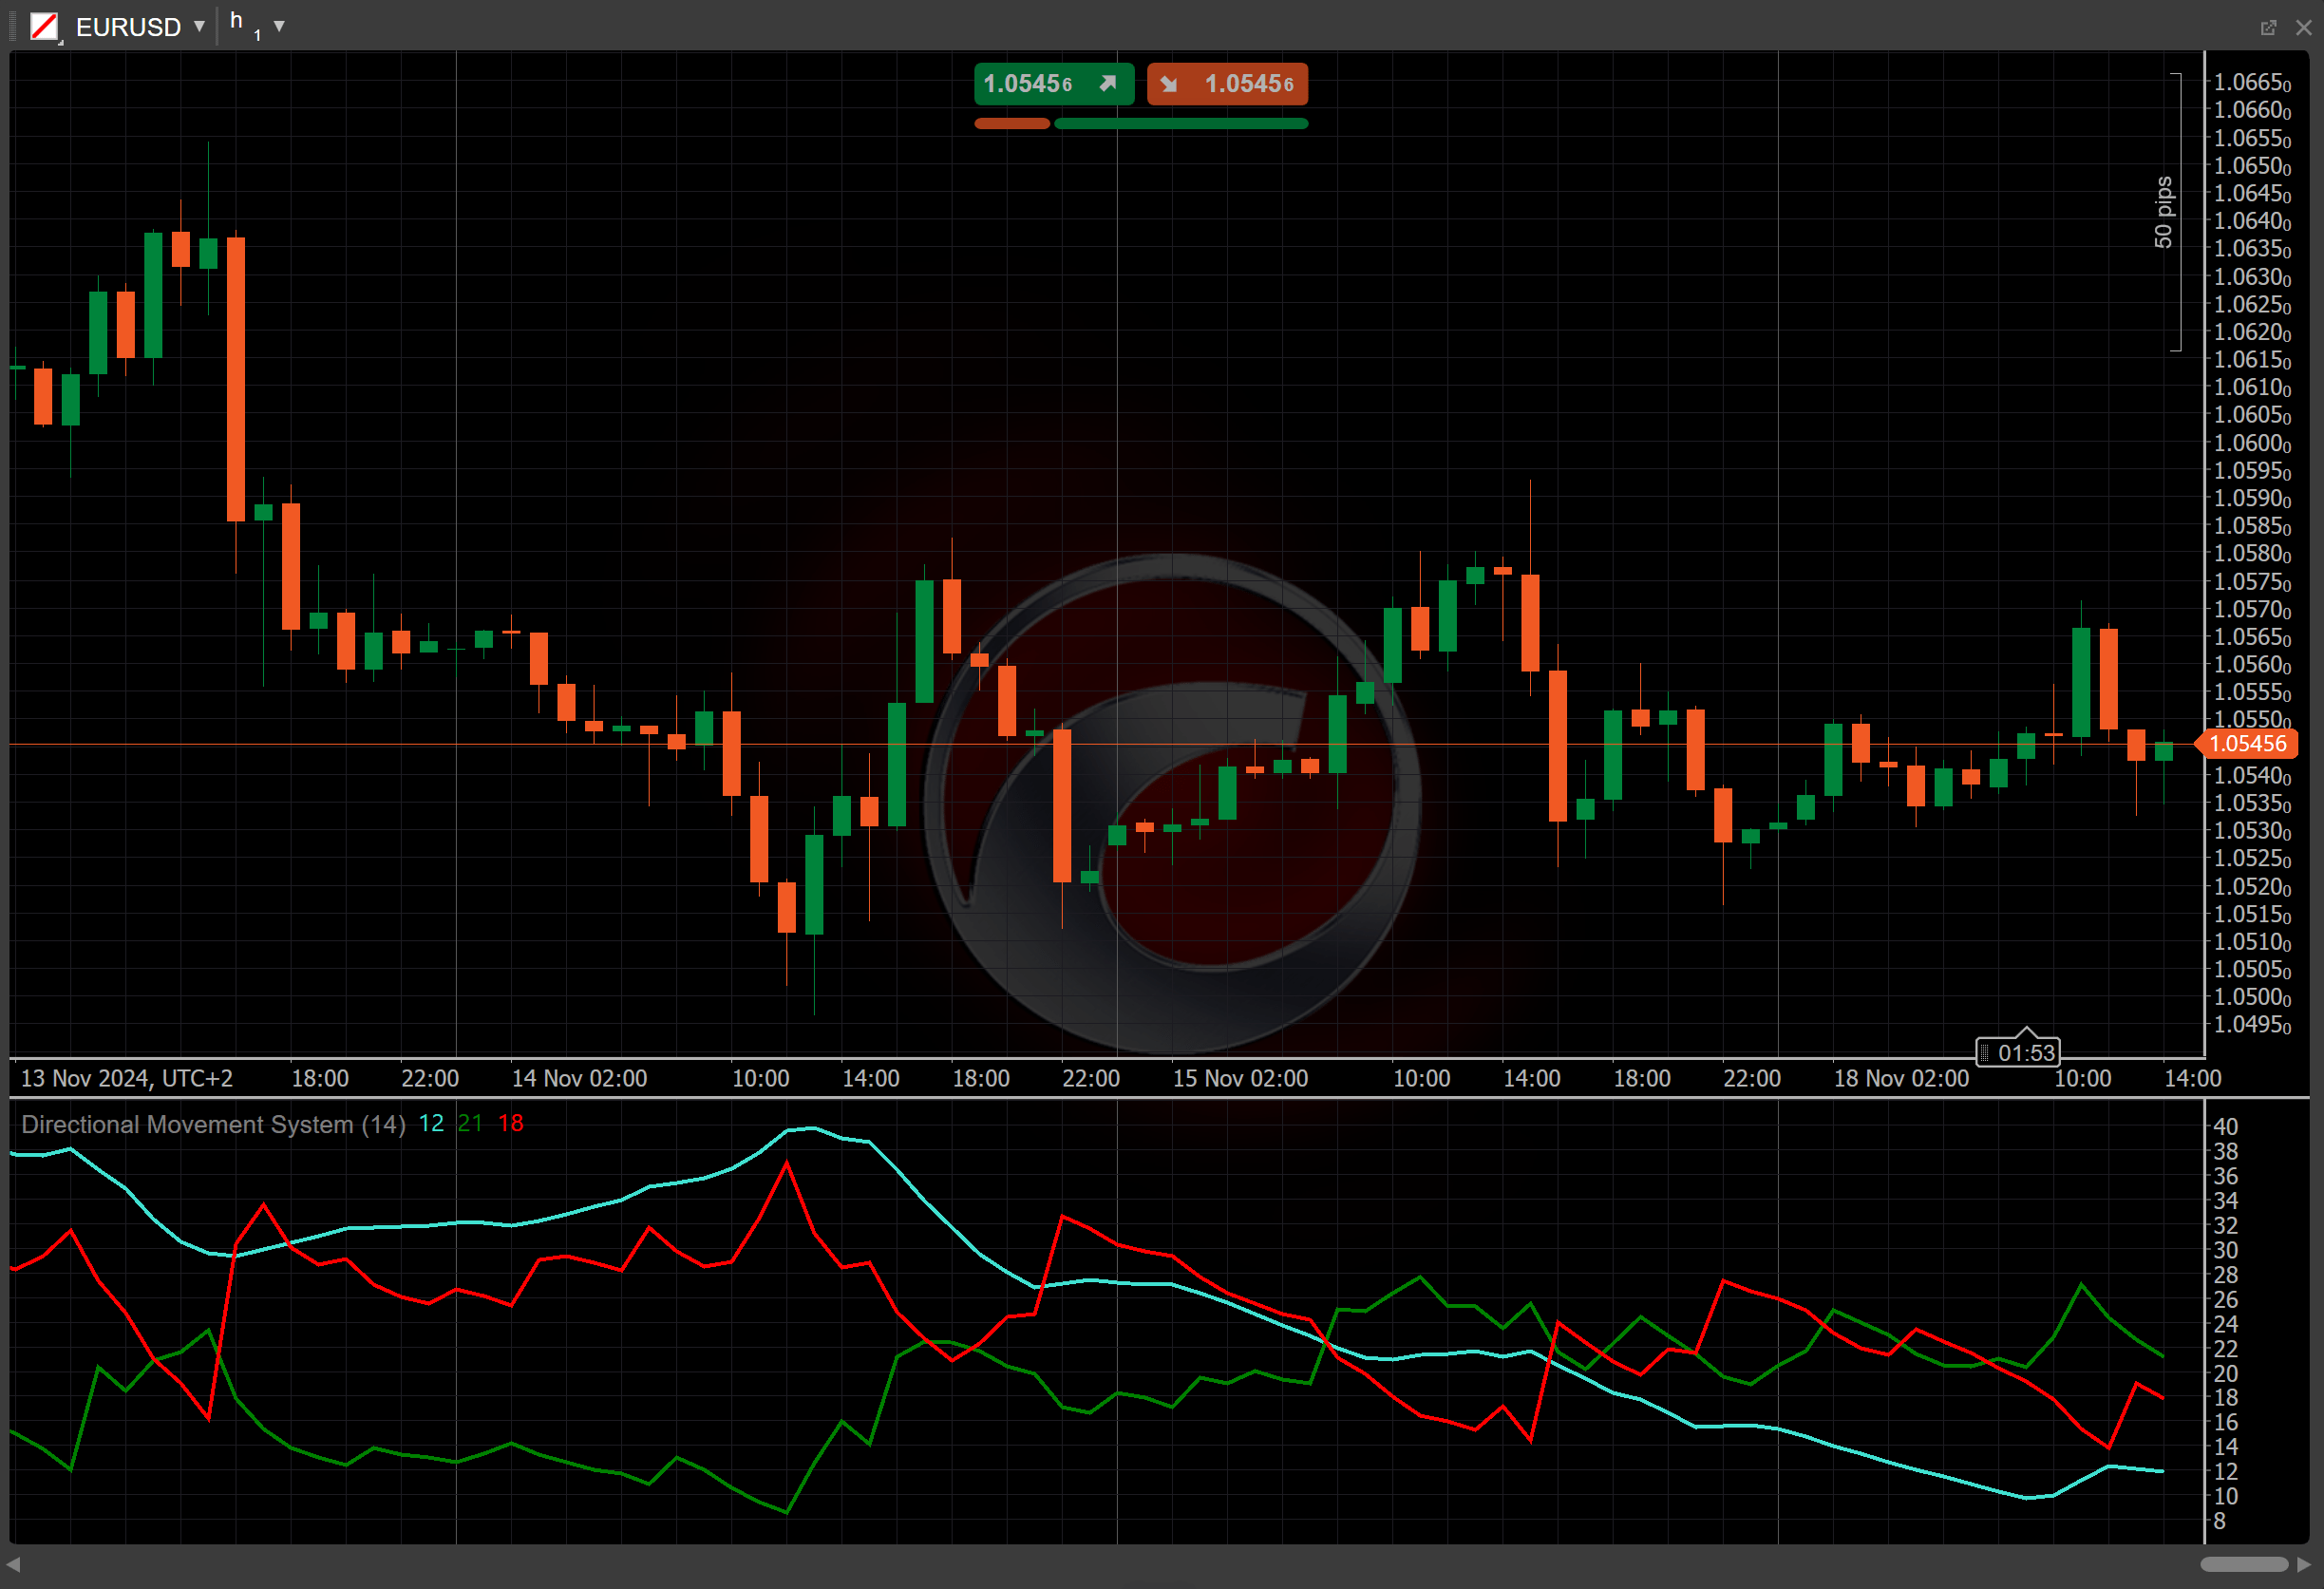
The Directional Movement System (DMS) is a technical analysis tool designed to help traders determine the strength and direction of a market trend. The system includes three key components: the Positive Directional Indicator, the Negative Directional Indicator and the Average Directional Index. These indicators together provide insights into whether a market is trending and the strength of that trend.


History
The Directional Movement System was developed by J. Welles Wilder, a prominent figure in the world of technical analysis and was introduced in his book "New Concepts in Technical Trading Systems" in 1978. This book also introduced several other important indicators, such as the Relative Strength Index (RSI) and the Average True Range (ATR). The DMS has since become one of the most widely used trend-following systems in trading.
Calculations
1. The Positive and Negative Directional Movements (DM+ and DM-) are determined by the difference between the current and previous highs or lows.
- If the current high minus the previous high is greater than the current low minus the previous low, DM+ is the difference between the current high and the previous high. Otherwise, DM+ is zero.
\[ DM^+ = { Current\ High - Previous\ High } \]
- If the current low minus the previous low is greater than the current high minus the previous high, DM- is the difference between the previous low and the current low. Otherwise, DM- is zero.
\[ DM^- = { Previous\ Low - Current\ Low } \]
2. The Positive and Negative Directional Indicators (DI+ and DI-) are collected as the ratio of smoothed directional movements to the Average True Range.
\[ DI^± = { { Smoothed\ (DM^±) \over ATR } \times 100 } \]
3. The Directional Movement Index (DX) is the ratio of the difference between DI+ and DI- to their sum.
\[ DX = { { { | DI^+ - DI^- | } \over { DI^+ + DI^- } } \times 100 } \]
4. The Average Directional Movement Index (ADX) is calculated as a moving average of the DX over \(n\) periods.
\[ ADX = { MA_{n} (DX) } \]
Interpretation
To calculate ADX, a typical lookback of 14 periods is used. The Wilder Smoothing Moving Average serves as a type of moving average.
The Directional Movement System provides a comprehensive view of trend direction and strength.
-
Directional indicators (+DI and -DI) – when the +DI is above the -DI, it indicates that the upward trend is stronger, suggesting potential buy signals. When the -DI is above the +DI, it suggests a downward trend, indicating potential sell signals.
-
Average Directional Index – an ADX value above 25 generally indicates a strong trend, while values below 20 suggest no significant trend or ranging market.
-
Crossovers – when the +DI crosses above the -DI, it suggests buying opportunities, especially if the ADX is rising. When the -DI crosses above the +DI, it signals selling opportunities, especially if the ADX is also rising.
Application
The Directional Movement System can be used in various trading strategies.
-
Identifying trend strength – traders use the ADX to assess whether the market is trending strongly. An ADX above 25 often indicates a strong trend, providing a favourable environment for trend-following strategies.
-
Buy and sell signals – when the +DI is above the -DI and the ADX is rising, traders often enter buy positions. Conversely, when the -DI is above the +DI and the ADX is rising, it signals sell opportunities.
-
Stop-loss placement – traders can use the ADX levels to place a stop loss. For example, setting a stop loss below recent lows in an uptrend confirmed by the ADX or above recent highs in a downtrend.
Note
You can take advantage of algo trading, with cBots executing trades based on the signals from this indicator, as shown in our examples. Learn more about how to use indicators in cBots.
Limitations
The Directional Movement System relies on past price data, which can result in lagging signals, especially in fast-moving markets. It is also less effective in ranging or choppy markets, as it tends to generate false signals when no clear trend is present. Additionally, the ADX does not indicate the direction of the trend, only its strength, which means traders still need to rely on the +DI and the -DI for directional cues.
Summary
The Directional Movement System, developed by J. Welles Wilder, is a powerful tool for identifying the direction and strength of a market trend. The system consists of three components: the Positive Directional Indicator, the Negative Directional Indicator and the Average Directional Index. The strength of the DMS lies within the data provided by those components. Gathering values from each of them and providing a holistic value enables the DMS to not only provide insights into whether a market is trending but also the strength of that trend.