Exponential Moving Average
Definition
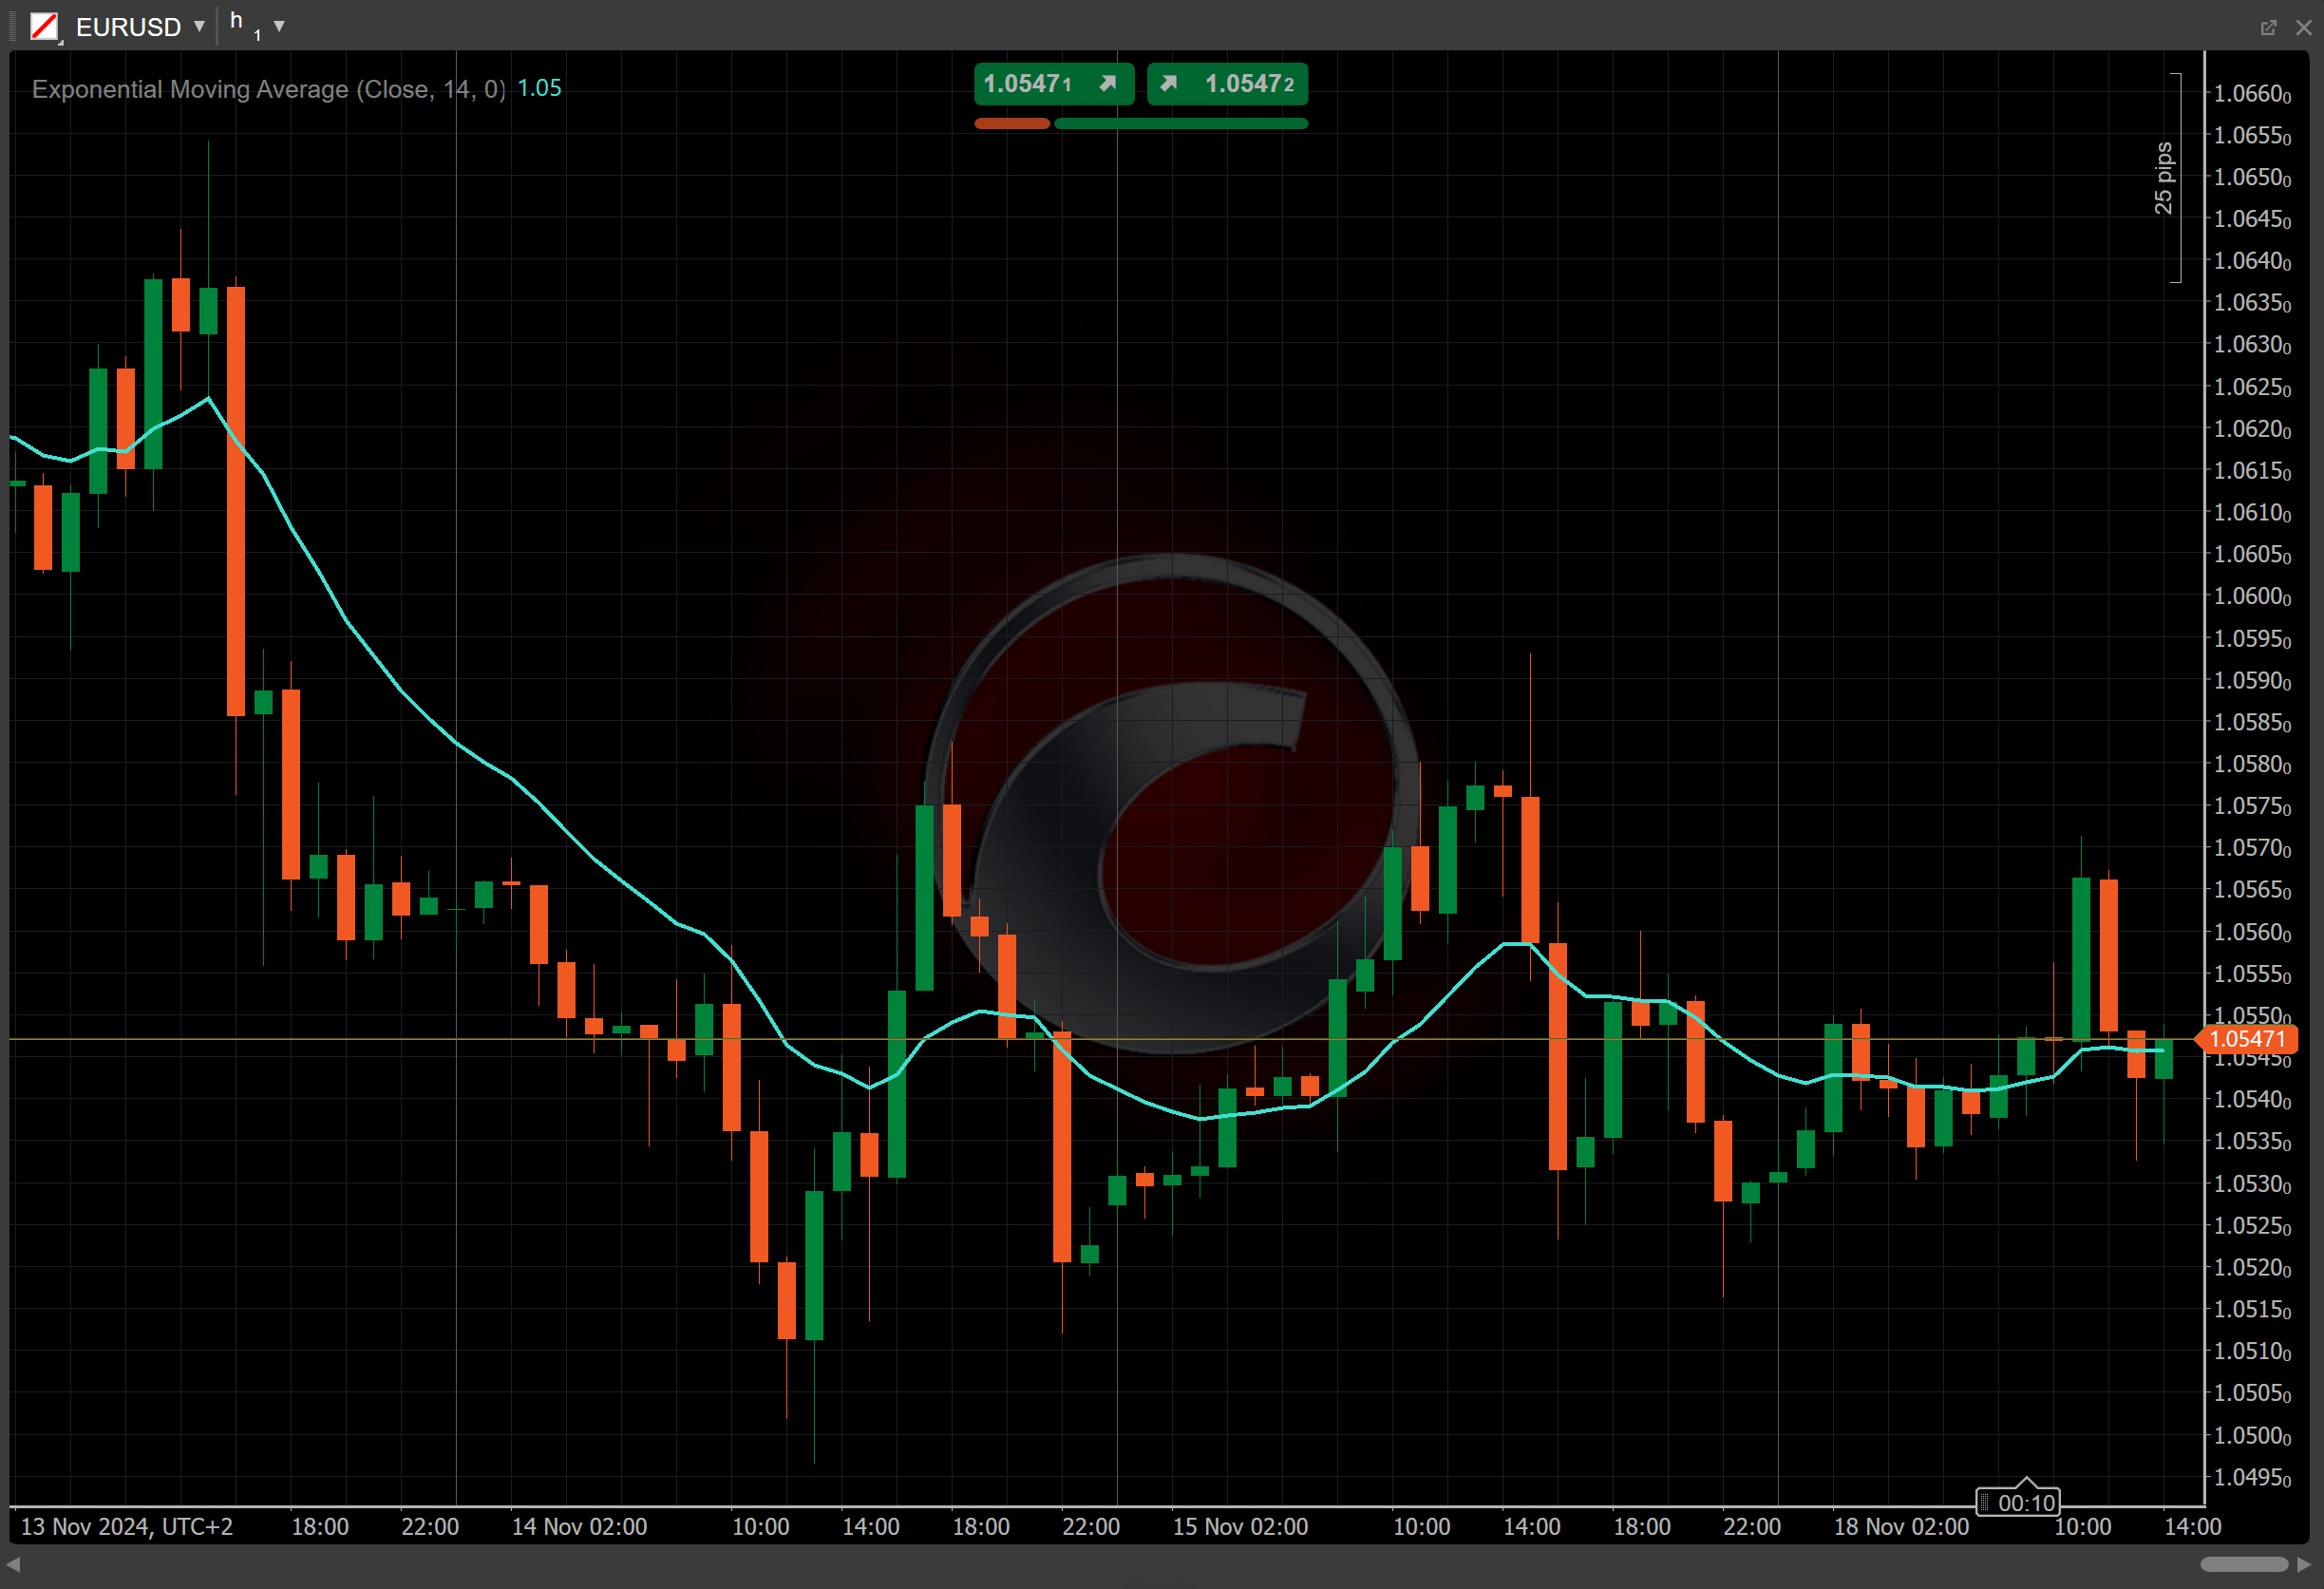
The Exponential Moving Average (EMA) is a type of moving average that places a higher weight on recent data points to make it more responsive to new information. It is commonly used in trading to smooth out price data and generate buy and sell signals based on price trends.


History
The EMA has roots in technical analysis, where moving averages have been a staple since the early 20th century. However, the formula for the Exponential Moving Average was refined during the 1950s to address lag issues found in the Simple Moving Average (SMA). It gained popularity with the rise of algorithmic trading and was further popularised in the trading community by technical analysts such as Welles Wilder and his work in "New Concepts in Technical Trading Systems", published in 1978.
Calculations
The EMA calculation involves both the current price and the previous EMA value, where more weight is given to recent price. The formula is as follows:
\[ EMA_i = { \alpha \times ( Price_{i} - EMA_{i-1} ) + EMA_{i-1} } \]
\(EMA_{i}\) – the current EMA value
\(EMA_{i-1}\) – the EMA value from the previous period
\(Price_i\) – the current closing price
\( \alpha = { 2 \over {n + 1} } \) – the smoothing factor calculated over \(n\) periods
Interpretation
-
Rising and falling – a rising EMA indicates a bullish trend, where recent prices are moving higher than older prices, suggesting increasing momentum. A falling EMA signals a bearish trend, where recent prices are moving lower, indicating downward momentum.
-
Shift – by adjusting the shift parameter to alter the alignment of the EMA indicator with price data on the chart, you can explore how the EMA readings correspond to past or future price movements.
Application
-
Crossover strategy – traders often use two EMAs with different time periods (such as a 50-day EMA and a 200-day EMA). A bullish signal occurs when the shorter-term EMA crosses above the longer-term EMA (called a golden cross). Conversely, a bearish signal (called a death cross) occurs when the shorter EMA crosses below the longer EMA.
-
Support and resistance – the EMAs can act as dynamic support or resistance levels, where the price tends to bounce off these lines.
-
Buy signal – a buy signal may occur when the price crosses above a rising EMA, indicating an upward trend.
-
Sell signal – conversely, a sell signal might occur when the price drops below a declining EMA, signalling bearish momentum.
-
Stop-loss placement – traders often use the EMA line as a stop-loss reference, placing stop orders just below the EMA line for long positions and just above it for short positions.
-
Combining with other indicators – to improve the accuracy of signals, traders often combine the EMAs with other indicators such as the Relative Strength Index (RSI) to confirm momentum or the Moving Average Convergence Divergence (MACD) for trend strength and reversals.
Note
You can take advantage of algo trading, with cBots executing trades based on the signals from this indicator, as shown in our examples. Learn more about how to use indicators in cBots.
Limitations
The EMA, like other moving averages, lags behind price action, meaning it may produce delayed signals, particularly in fast-moving or highly volatile markets. Additionally, in sideways or choppy markets, the EMA can generate false signals, leading traders into losing positions.
Summary
The Exponential Moving Average is a widely used indicator that places greater emphasis on recent price data to provide a clearer picture of momentum and trend direction. Traders use it to identify trends, generate buy and sell signals and manage risk. Its development process involved addressing lag issues found in the Simple Moving Average. The EMA continued to garner popularity alongside the rise and development of algorithmic trading.