Simple Moving Average
Definition
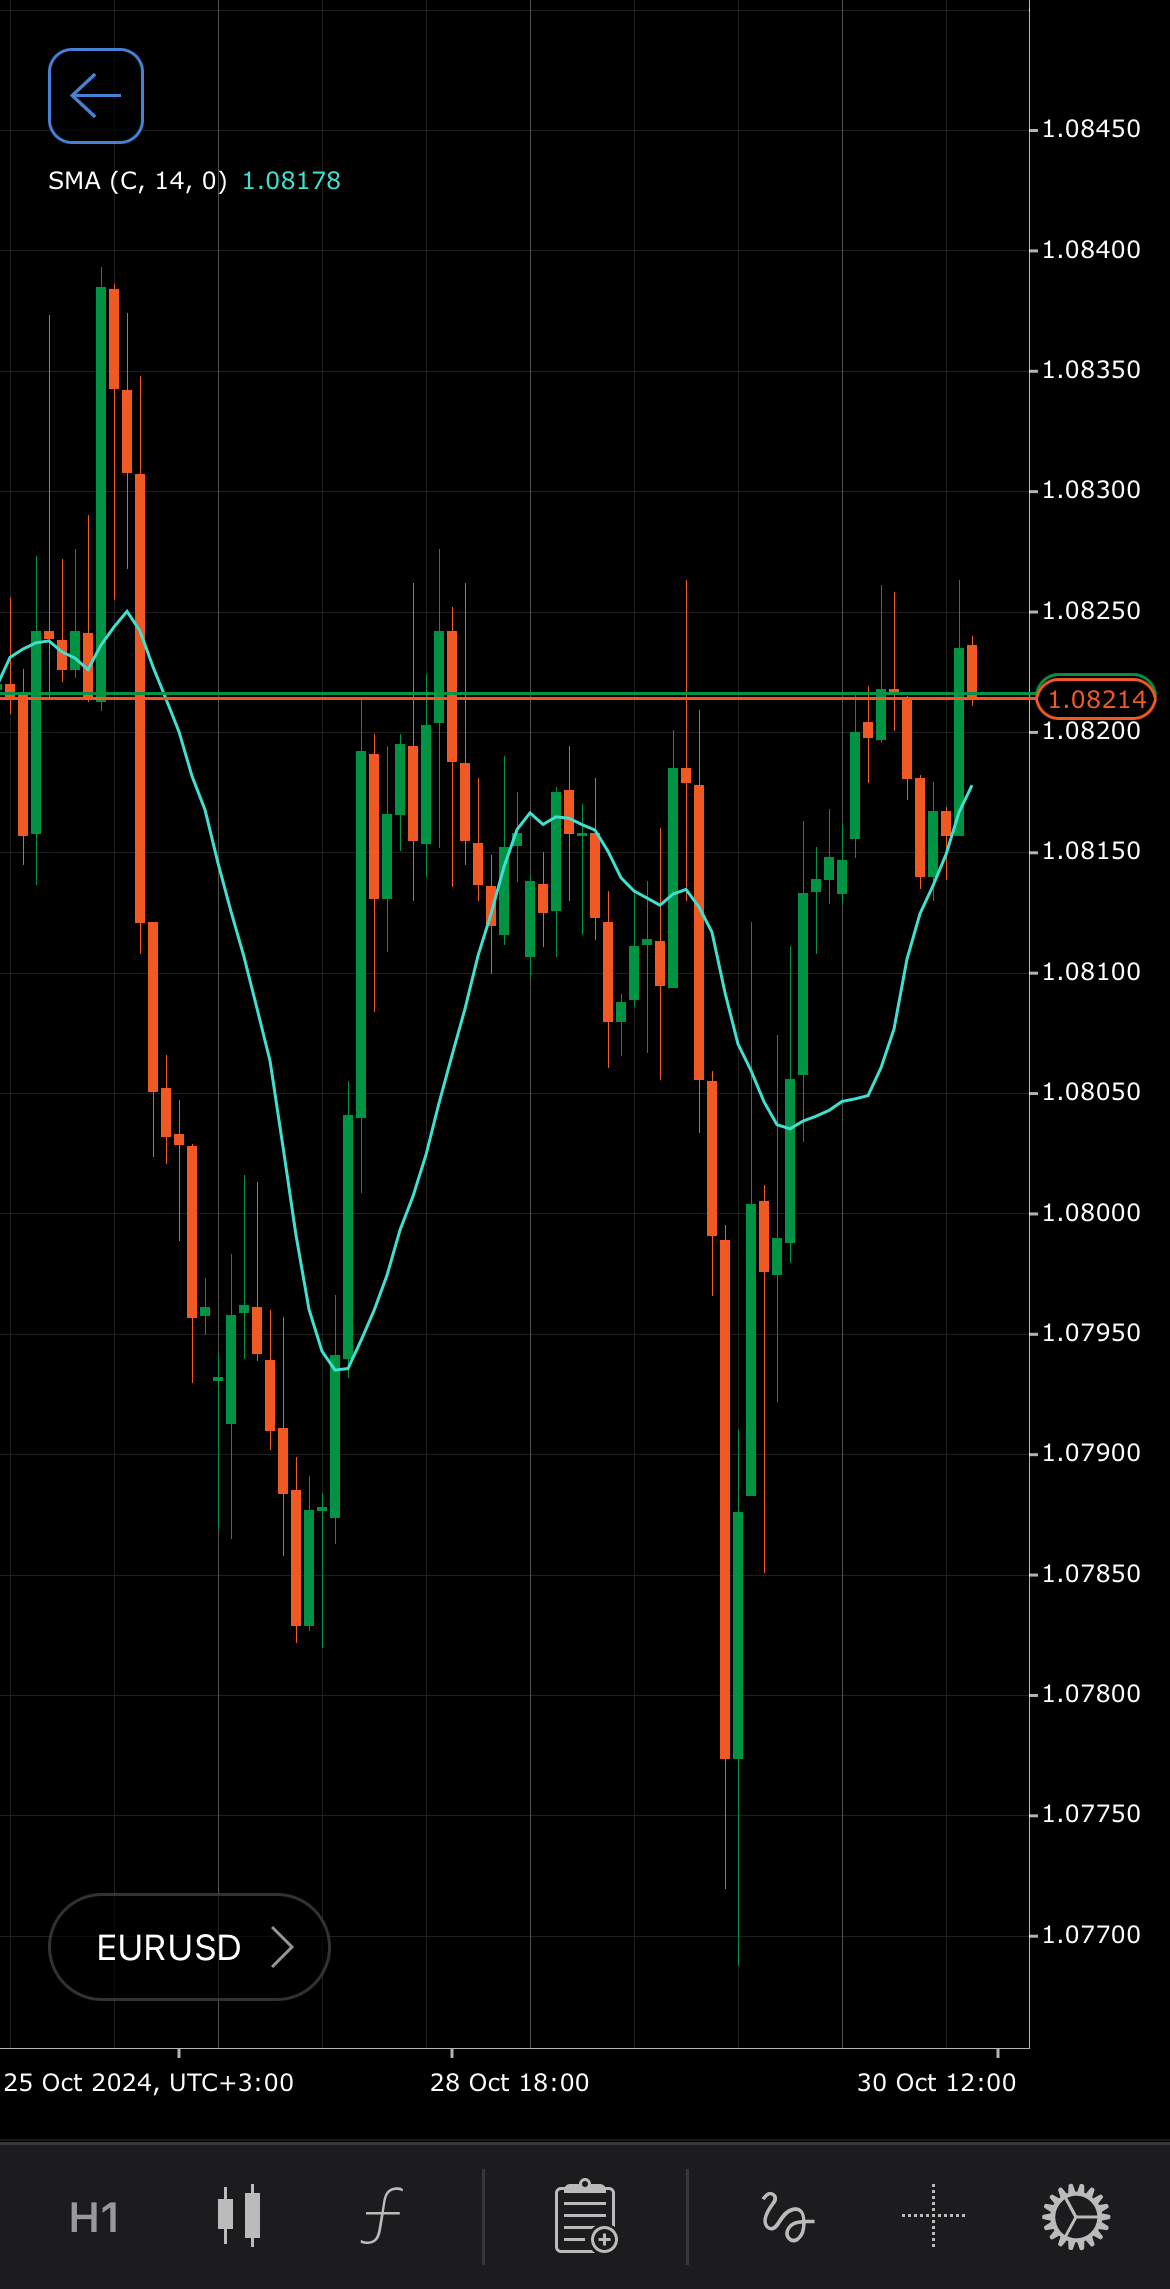
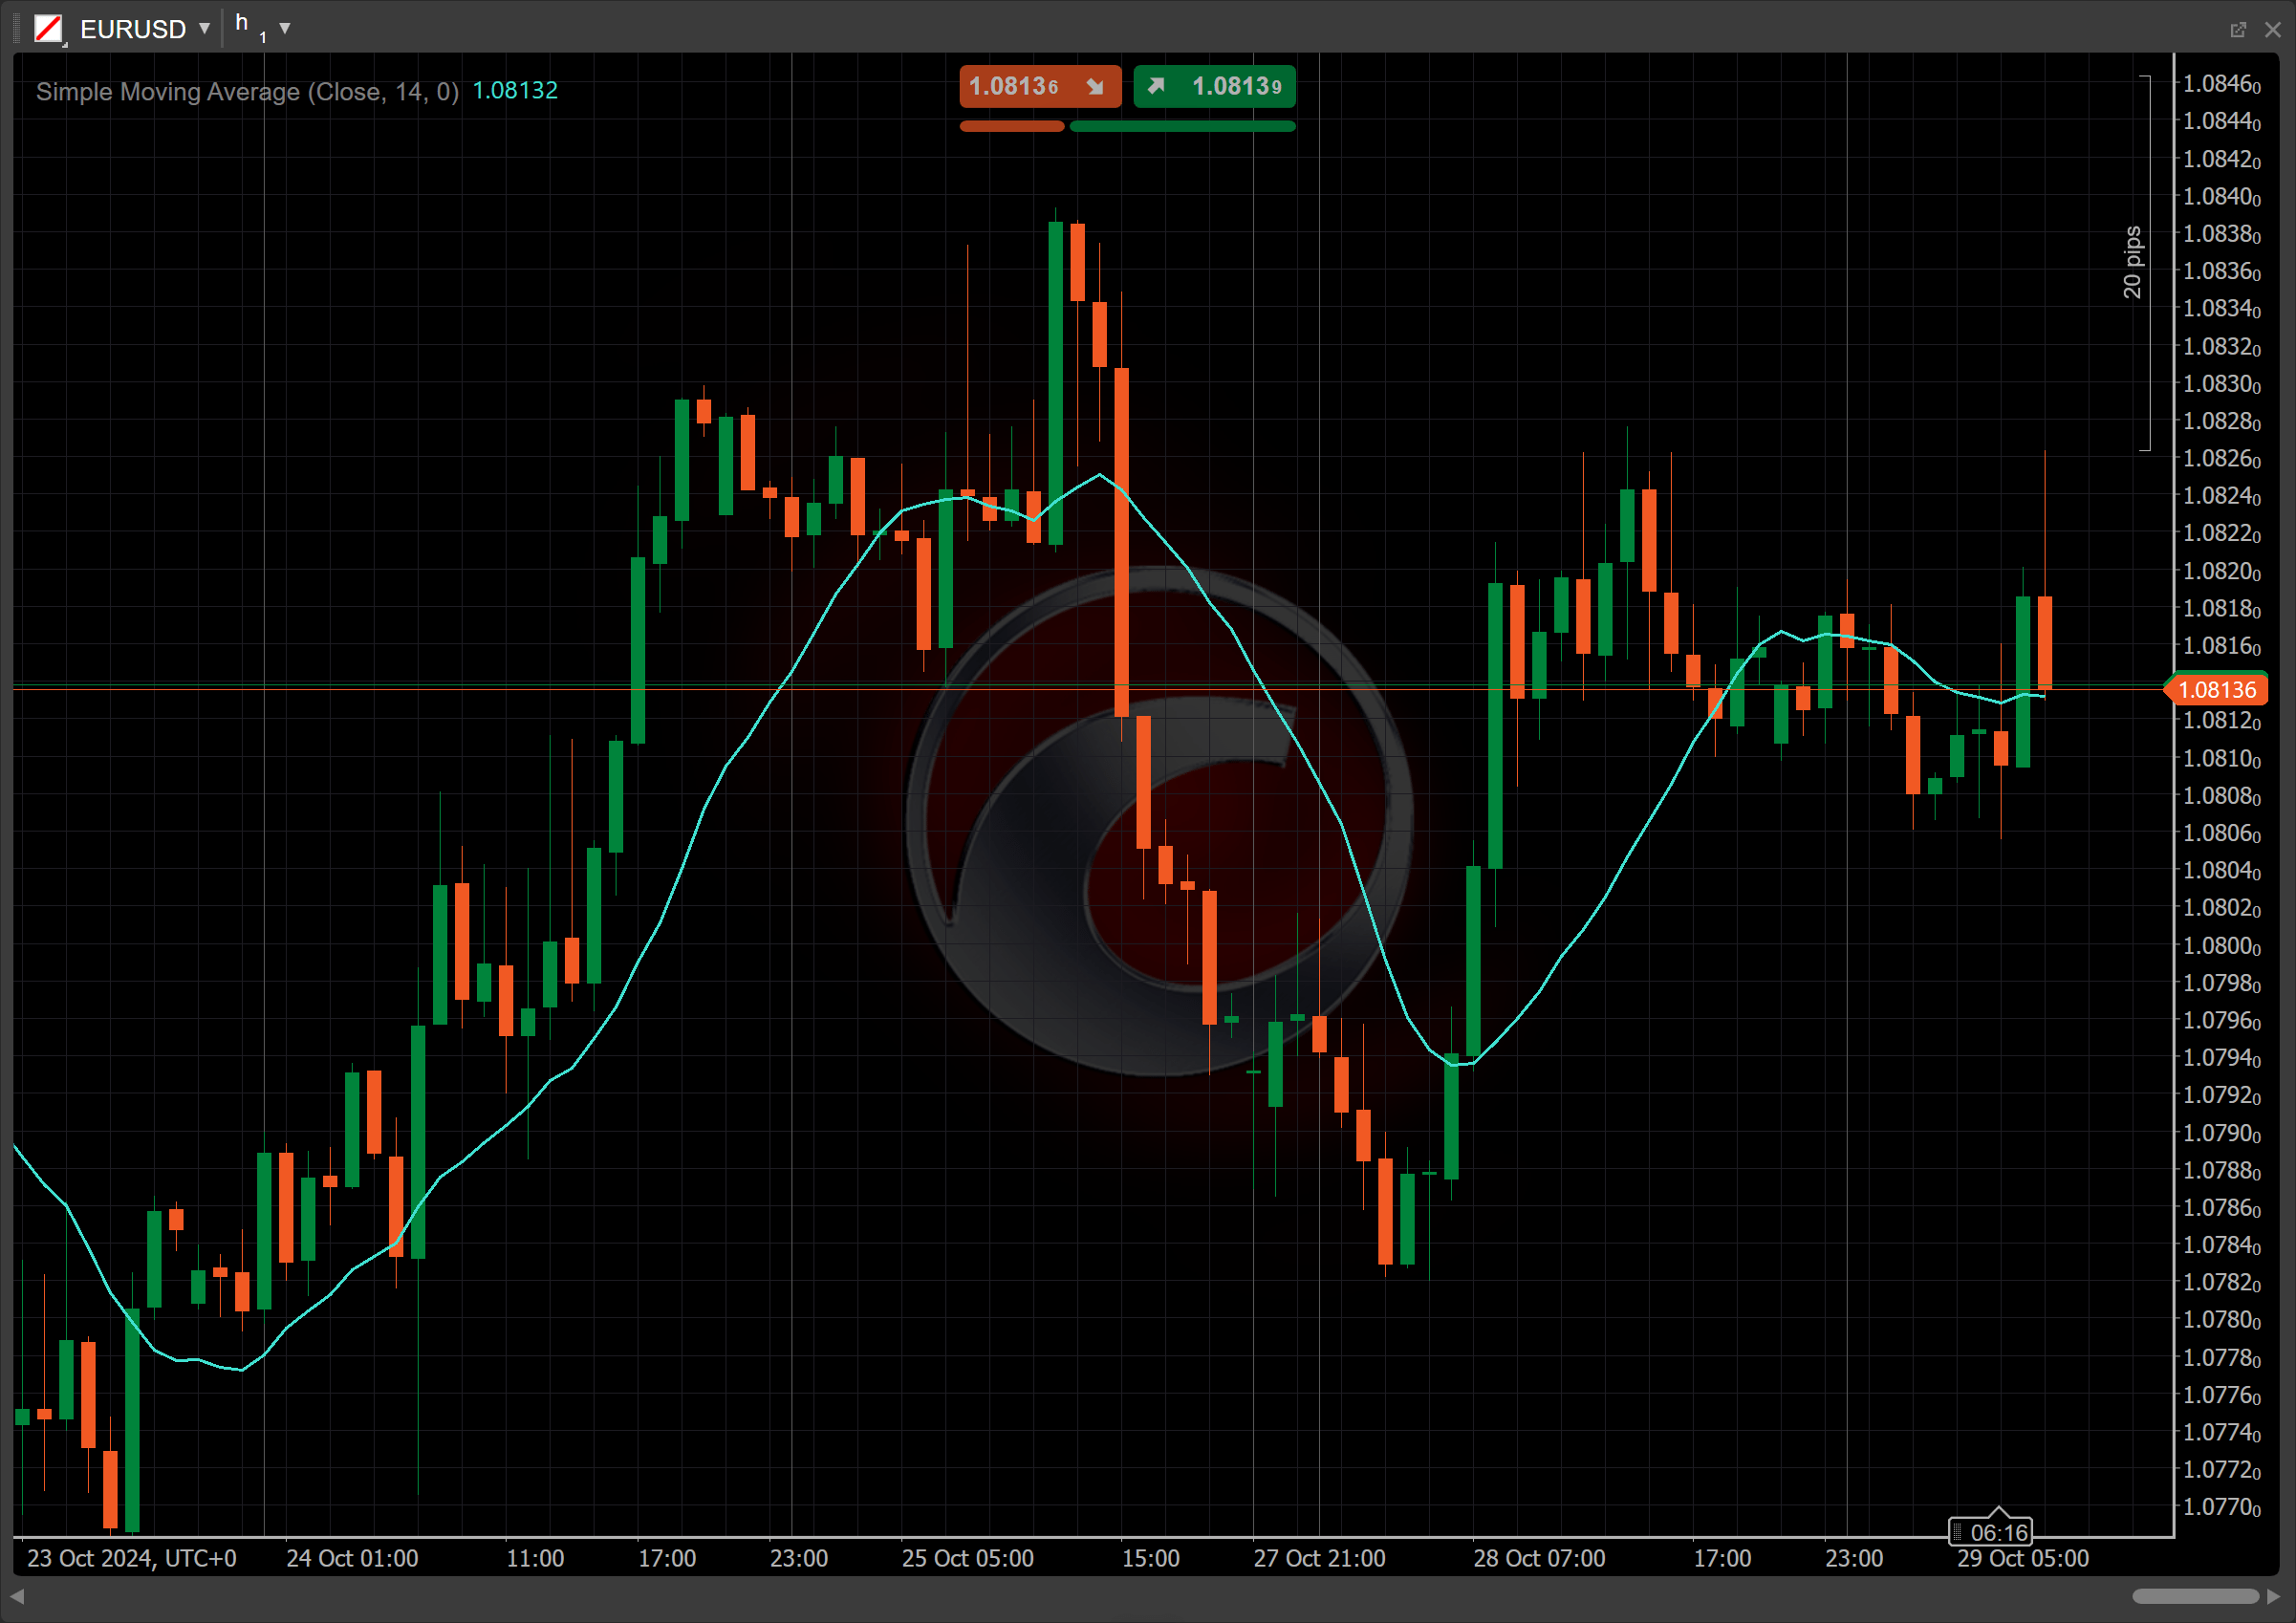
The Simple Moving Average (SMA) is a technical indicator used to smooth out price data over a specified period, helping to identify trends by filtering out short-term fluctuations. The SMA is calculated by averaging the prices (typically closing prices) of a symbol over a fixed number of periods. It provides a straightforward way to assess the direction of a trend and is commonly used to confirm trend reversals, identify support and resistance levels, and generate buy or sell signals when compared with other moving averages or the current price.


History
The SMA indicator is one of the oldest and most fundamental tools in technical analysis, with roots tracing back to early market analysis methods. It has been used for decades by traders and analysts to identify trends by smoothing out price fluctuations over time. Its simplicity and effectiveness have made it a cornerstone in trading strategies, and it remains widely accessible on most trading platforms and financial markets, including but not limited to forex.
Calculations
The Simple Moving Average is an arithmetic moving average calculated by the following formula:
\[ SMA = { 1 \over n } { \sum_{i=1}^n { A_i } } \]
\(A_i\) – the closing price at \(i\) period
\(n\) – the number of periods
Interpretation
By default, the number of periods for the SMA indicator is set to 14 (short-term SMA), but it can be adjusted across a wide range, such as 10, 50 or 200 periods, depending on the trader strategy and the period of analysis.
The main patterns of the indicator behaviour can be interpreted as follows:
-
Price line crossovers – the crossover between a short-term SMA and the price line can signal momentum shifts. When the price crosses above the SMA, it suggests the start of an uptrend or a potential buy signal, while a crossover below the SMA indicates weakening momentum and may signal a downtrend or a sell opportunity.
-
Crossovers – a bullish crossover occurs when a short-term SMA (such as 20-day) crosses above a longer-term SMA (such as 50-day), suggesting an upward trend or buy signal. A bearish crossover occurs when a short-term SMA crosses below a longer-term SMA, indicating a potential downtrend or sell signal.
-
Rising and falling – a rising SMA indicates that prices are generally trending higher, and market sentiment may be bullish. A falling SMA signals that prices are trending downward, often associated with bearish sentiment.
-
Reversal points – when the price moves far above or below the SMA, it may suggest that the asset is overbought or oversold, potentially indicating an upcoming reversal or correction.
-
Shift – adjusting the shift parameter alters the alignment of the SMA indicator with price data on the chart, helping you explore how the readings correspond to past or future price movements.
Application
-
Buy signal – a potential buying opportunity occurs when the price crosses above a short-term SMA (such as 14-period) or when a short-term SMA crosses above a longer-term SMA (such as 50-period), indicating upward momentum.
-
Sell signal – a potential selling opportunity arises when the price drops below the SMA or when a short-term SMA crosses below a longer-term SMA, suggesting downward momentum.
-
Stop-loss placement – traders may place a stop loss just below the SMA to limit losses in case of a sudden reversal, as a break below the SMA can signal weakening momentum.
-
Exit strategies – an exit signal can be triggered when the price falls back below the SMA after a period of trading above it, or when two SMAs cross in the opposite direction from the entry signal.
-
Confirming trades – the SMA signals are often combined with other indicators, such as the Relative Strength Index (RSI) or the MACD, to confirm trends and avoid false signals. Long-term SMAs (such as 200-day) are also used to confirm the direction of the overall market trend.
Note
You can take advantage of algo trading, with cBots executing trades based on the signals from this indicator, as shown in our examples. Learn more about how to use indicators in cBots.
Limitations
The SMA indicator reacts slowly to price changes, making it less effective during volatile markets or rapid trend reversals. It can also generate false signals, especially in ranging markets, leading to potential whipsaws. The lag of the SMA indicator can cause delays in entry and exit points, which limits its responsiveness to sudden shifts.
Summary
The Simple Moving Average is a widely used technical indicator that smooths price data over a specified period, assisting traders in identifying trends and potential reversals. By averaging past prices, the SMA filters out market noise and provides a clearer picture of market direction. It is valuable for assessing momentum and can indicate support and resistance levels. Additionally, the SMA can serve as the basis for other indicators, guiding entry and exit points and making it an essential component of effective trading strategies.