Chaikin Volatility
Definition
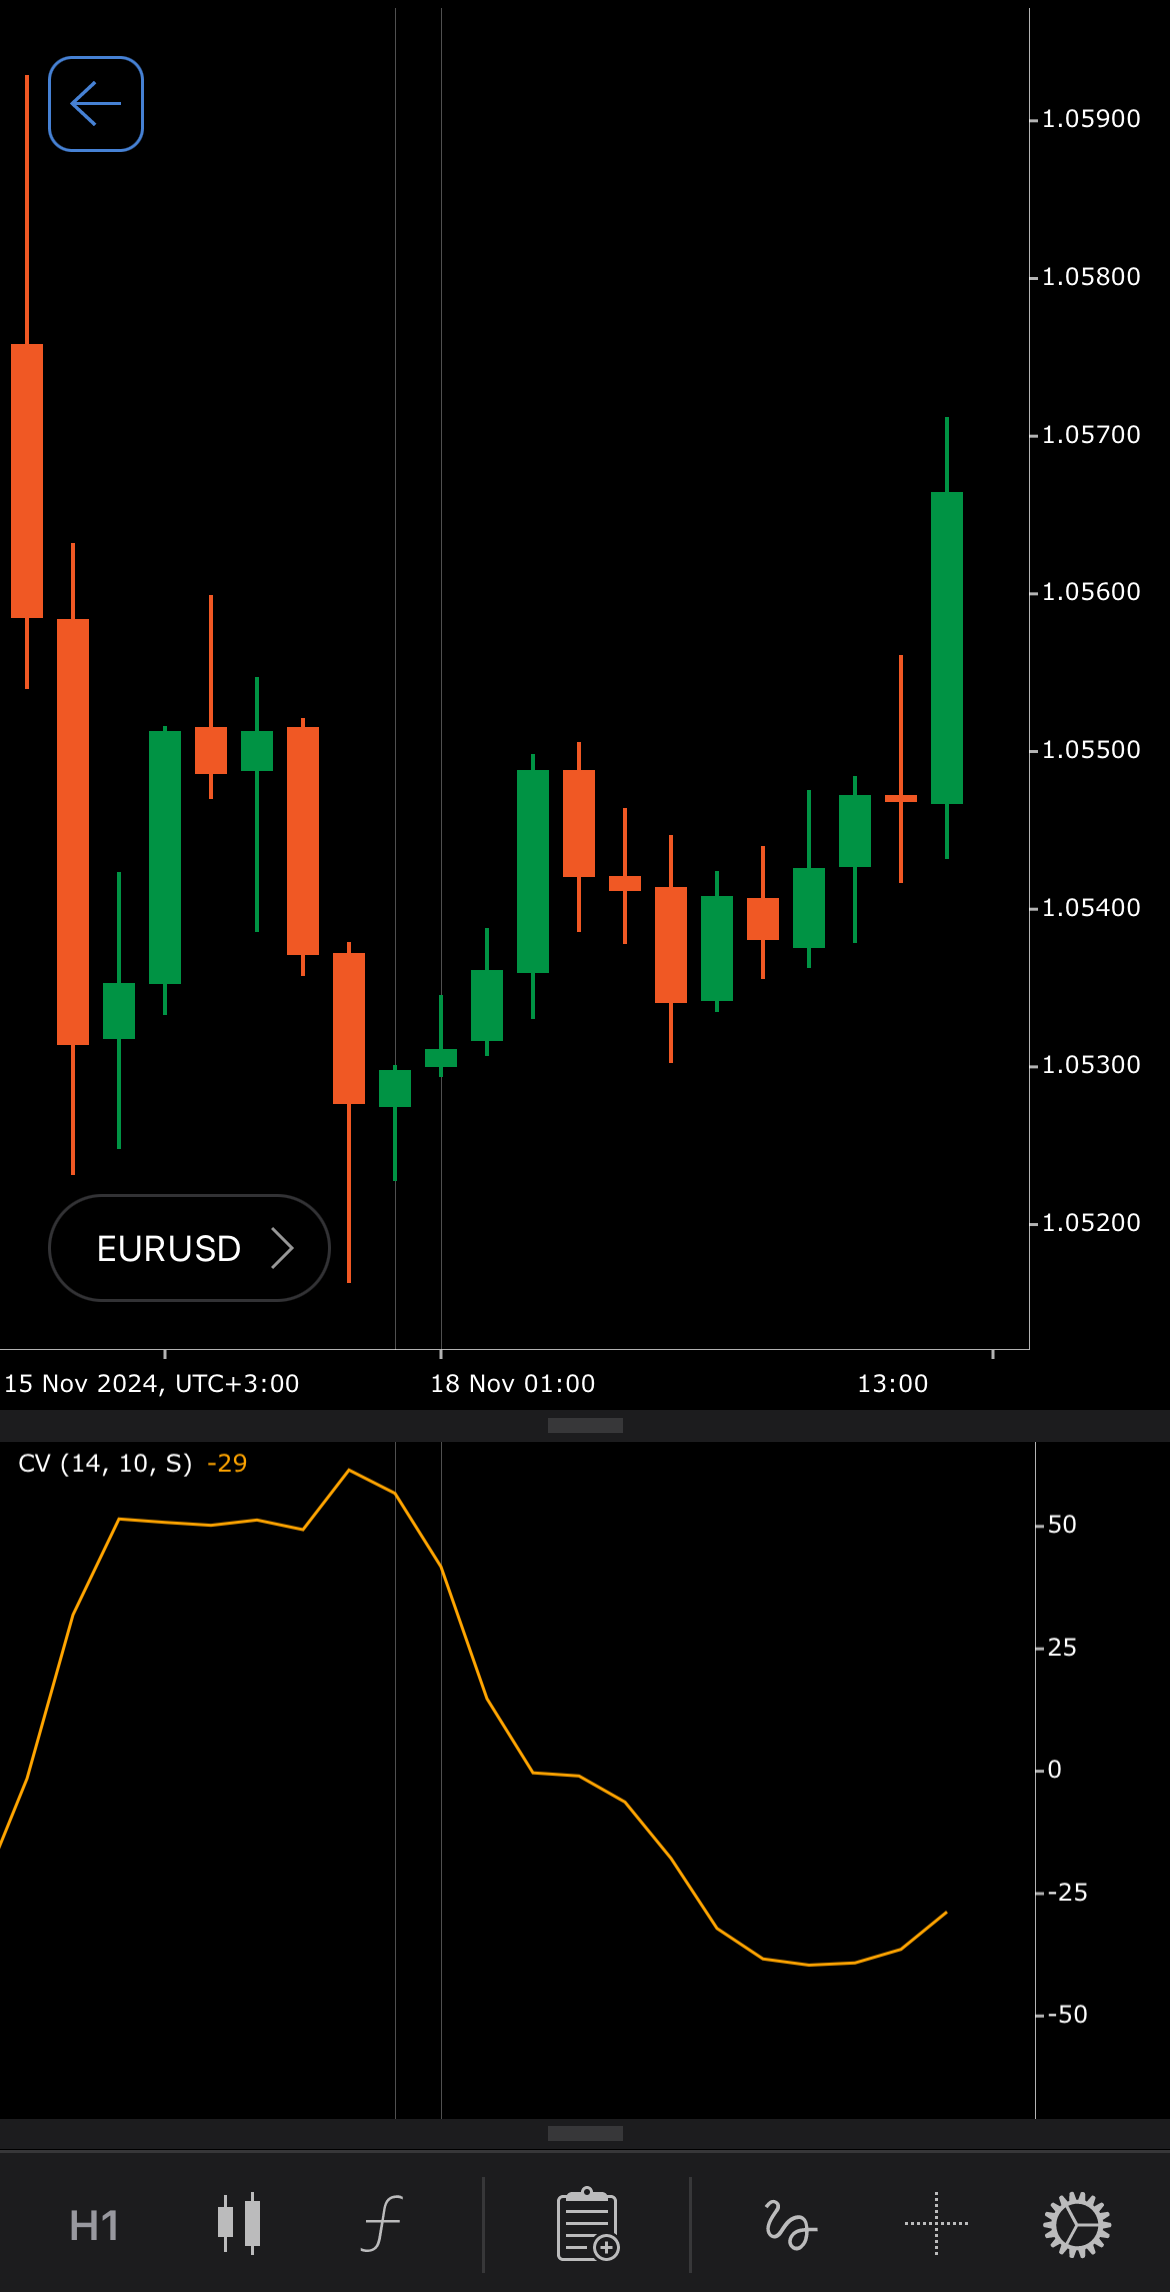
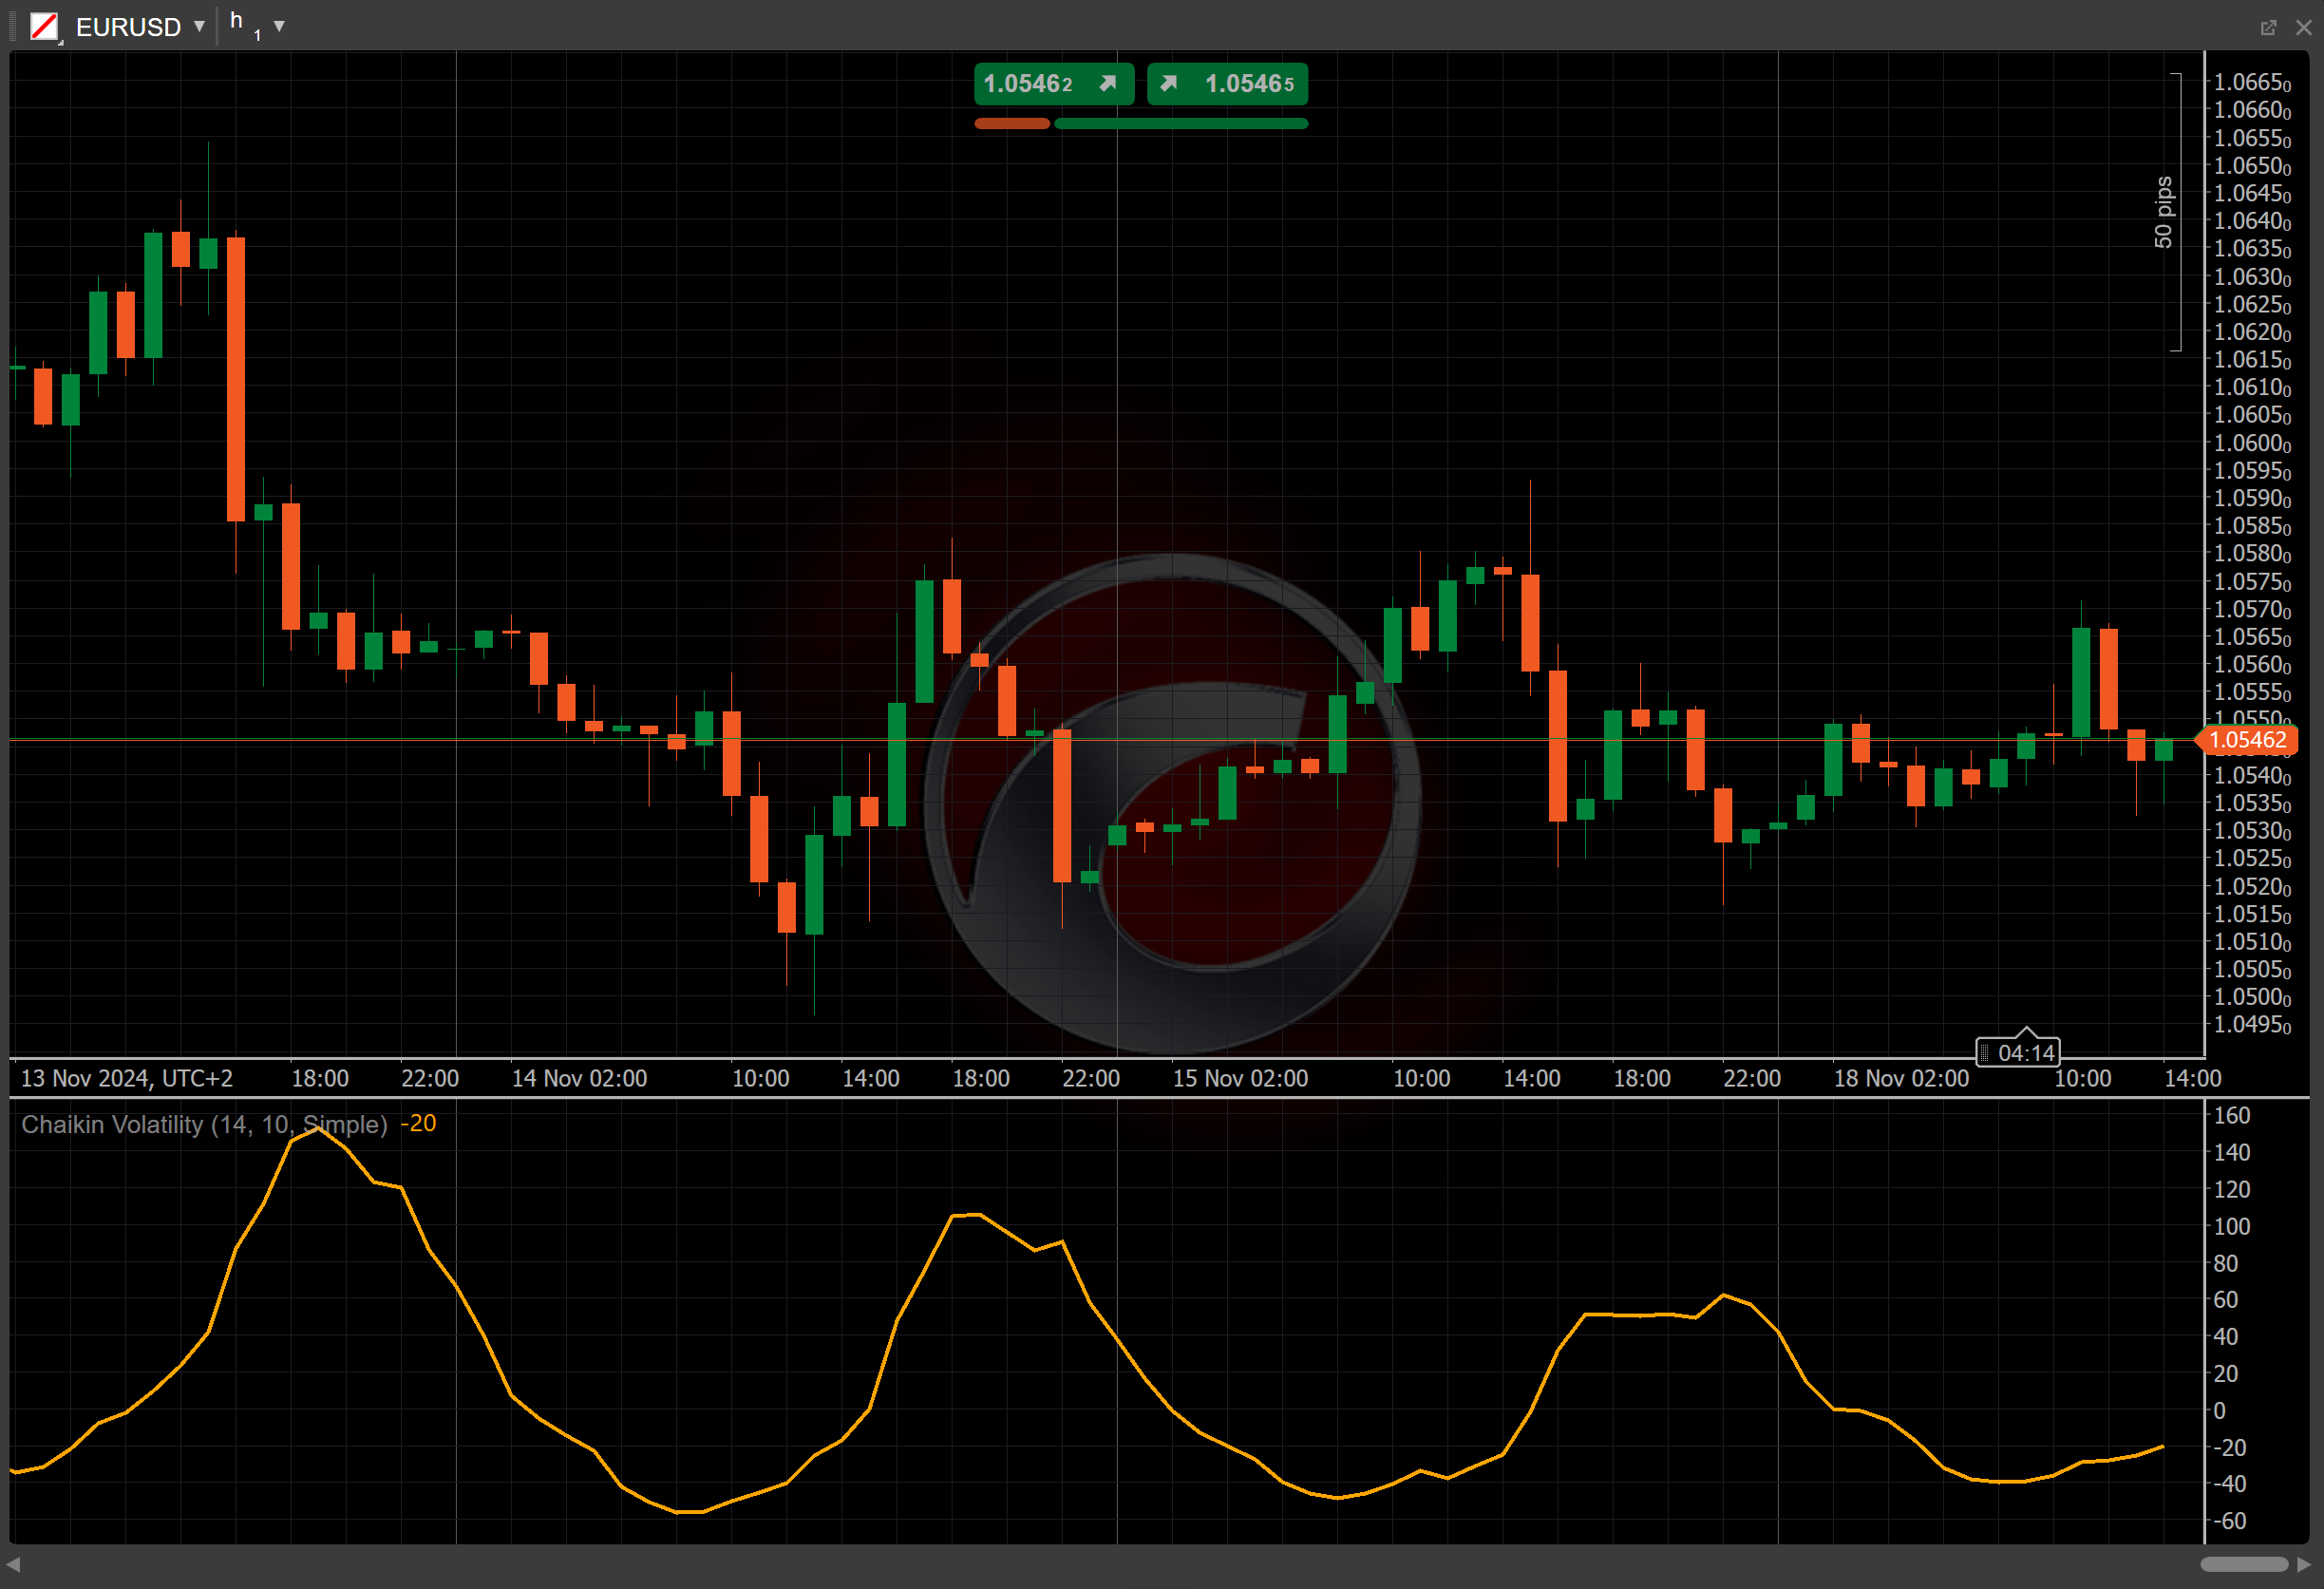
The Chaikin Volatility indicator (CV) is a technical analysis tool that measures the volatility of an asset by comparing the spread between high and low prices over a specified period. Unlike other volatility indicators, it does not track price direction but focuses solely on volatility changes, providing insights into potential market reversals or breakouts.
History
The Chaikin Volatility indicator was developed by Marc Chaikin, a well-known market analyst who also created indicators like the Chaikin Money Flow (CMF) and the Chaikin Oscillator, which were introduced in the 1970s. The Chaikin Volatility helps traders detect shifts in market volatility, often signalling potential breakouts or trend reversals.
Calculations
The Chaikin Volatility is calculated by measuring the percentage rate of change in the moving average of the high-low price range over a specified period.
\[ CV = { { MA_{current} − MA_{ROC} } \over MA_{ROC} } \times 100 \]
\( MA_{current} = Moving\ Average ( {H - L, Periods})_{current} \) – the moving average for the current period
\( MA_{ROC} = Moving\ Average ( {H - L, Periods})_{current - ROC} \) – the moving average for the Rate of Change (ROC) period
\( ( H - L ) \) – the difference between the high and low prices
\(Periods\) – the specified period for the moving average
Interpretation
By default, the Simple Moving Average over a 14-period is used to calculate the moving average values and the ROC shift is set to 10 periods. These parameters can be adjusted to suit different market conditions and trading strategies.
The Chaikin Volatility does not provide buy or sell signals directly, but it can give traders valuable insights into market conditions.
-
Rising – an increase in the CV indicates expanding trading ranges, suggesting heightened market volatility. This scenario often precedes significant price movements, as increased volatility can signal potential breakouts or breakdowns.
-
Falling – a decrease in the CV suggests narrowing trading ranges, indicating reduced market volatility. This condition may precede periods of consolidation or trend reversals, as diminishing volatility can reflect a lack of market momentum.
-
Divergence – a divergence between the CV and the price movement can signal potential trend reversals. For instance, if the price is rising while the CV is falling, it may indicate weakening momentum and a possible upcoming downturn.
Application
The Chaikin Volatility is often used to evaluate market volatility and assist with timing trades.
-
Buy signal – a significant increase in volatility, as indicated by a sharp rise in the CV, may suggest the potential for a market bottom. This is because heightened volatility often occurs during periods of market panic or capitulation, which can precede a reversal to the upside. Traders might consider this as a buy signal, anticipating a rebound.
-
Sell signal – conversely, a substantial decrease in volatility, reflected by a sharp decline in the CV, can indicate a potential market top. This scenario suggests that the market is becoming complacent and a reversal to the downside may be imminent. Traders might interpret this as a sell signal, preparing for a potential downturn.
-
Stop-loss placement – the CV can assist in setting stop-loss levels by providing insights into current market volatility. In periods of high volatility, traders might opt for wider stop-loss levels to accommodate larger price swings, thereby avoiding premature exits. During low volatility, tighter stop-loss levels could be appropriate, as price movements are more subdued. Adjusting stop-loss placements based on volatility helps in managing risk more effectively.
Note
You can take advantage of algo trading, with cBots executing trades based on the signals from this indicator, as shown in our examples. Learn more about how to use indicators in cBots.
Limitations
The Chaikin Volatility indicator may provide false signals in range-bound markets by not providing specific buy or sell signals. The CV is also highly sensitive to the chosen period.
Summary
The Chaikin Volatility indicator does not track price direction but measures market volatility by comparing the spread between high and low prices over a period. It helps traders identify potential breakouts and trend reversals by highlighting periods of increasing or decreasing volatility.