Donchian Channel
Definition
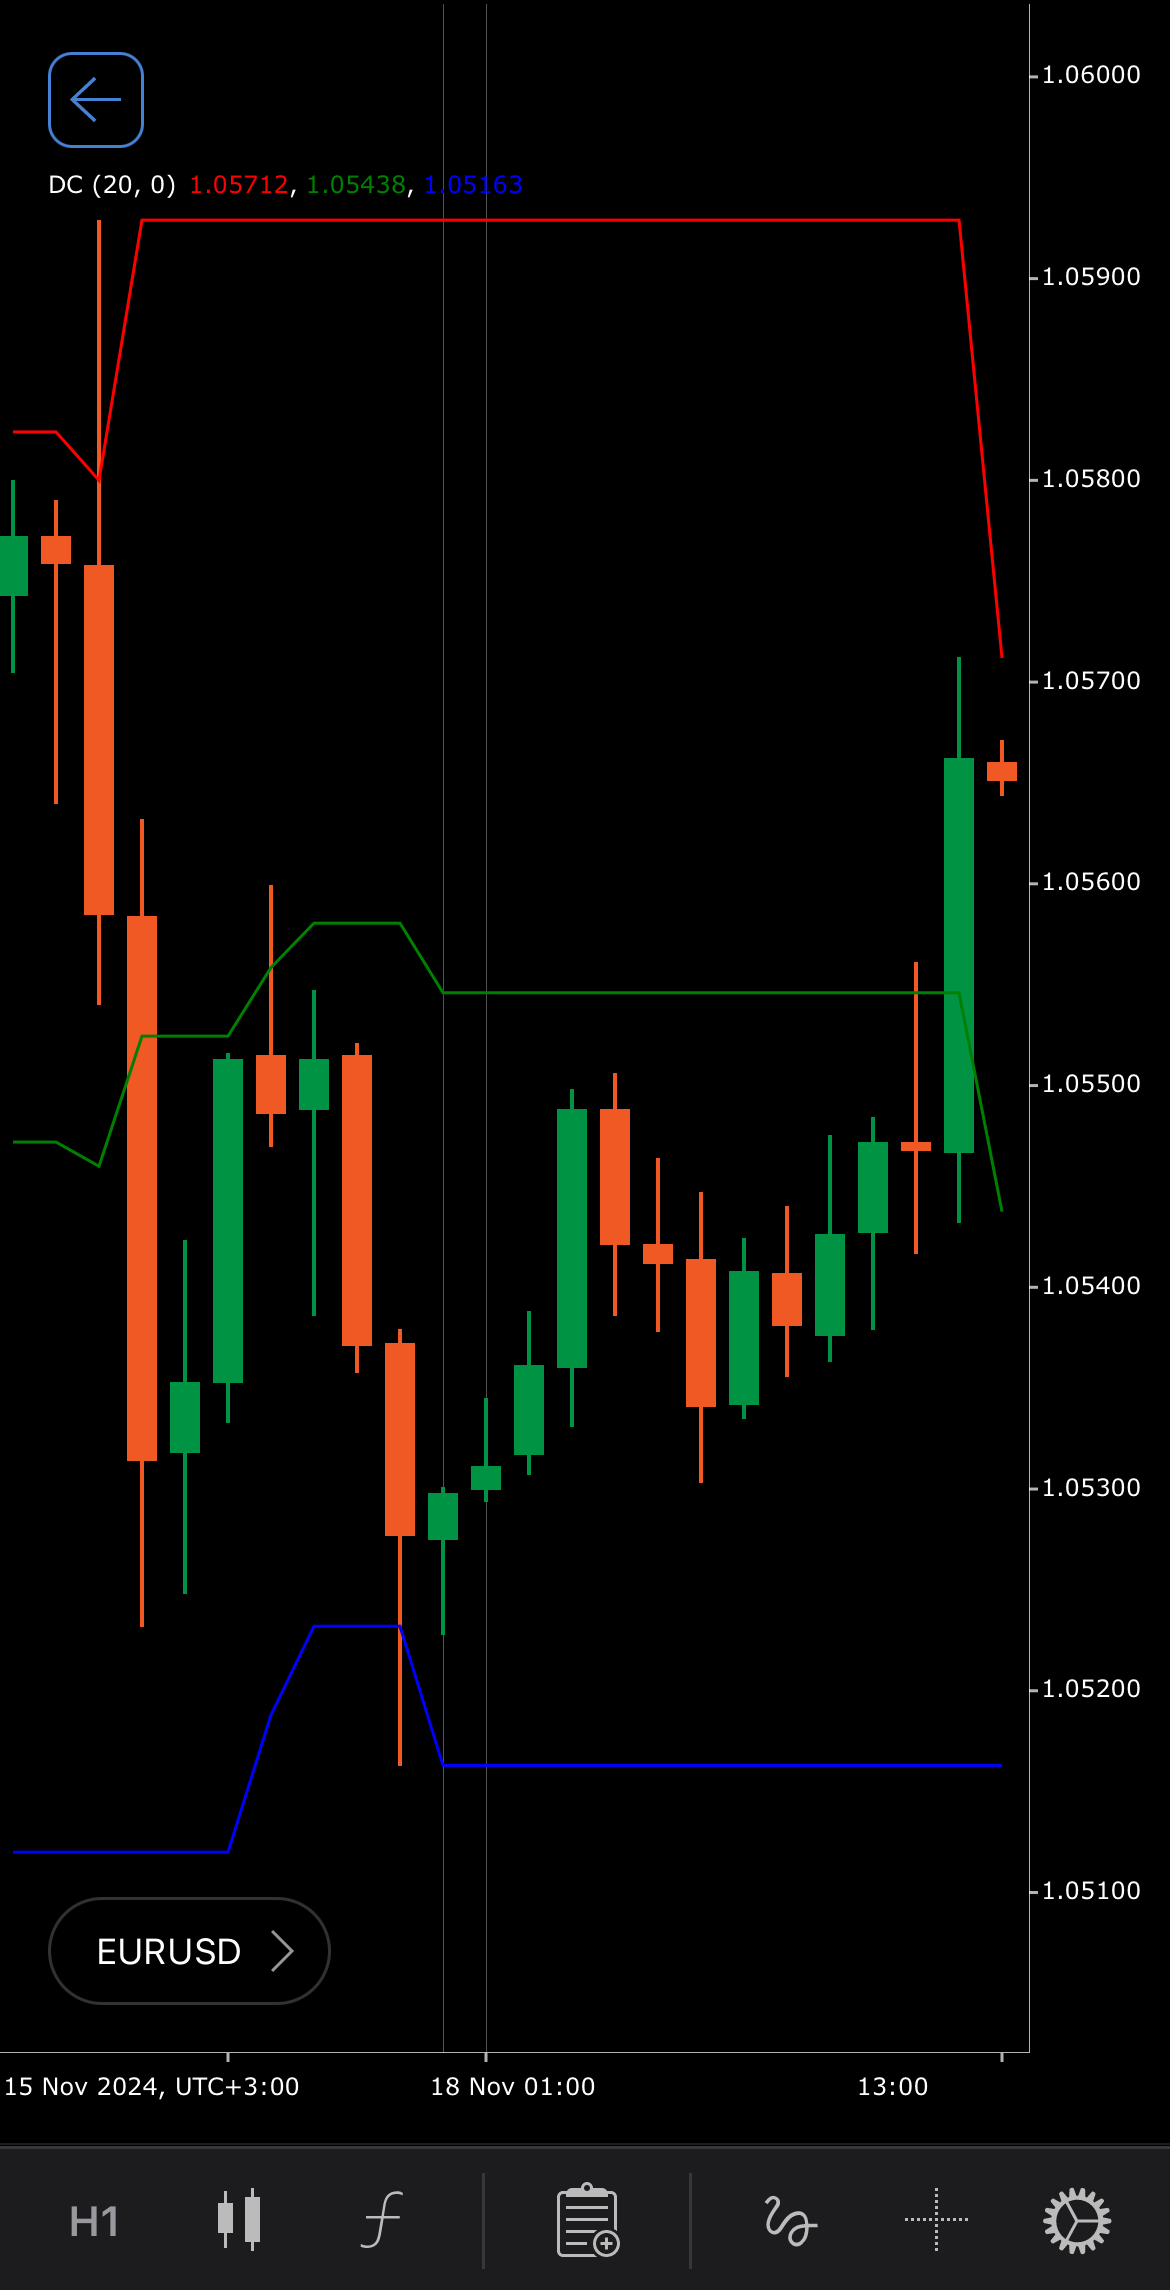
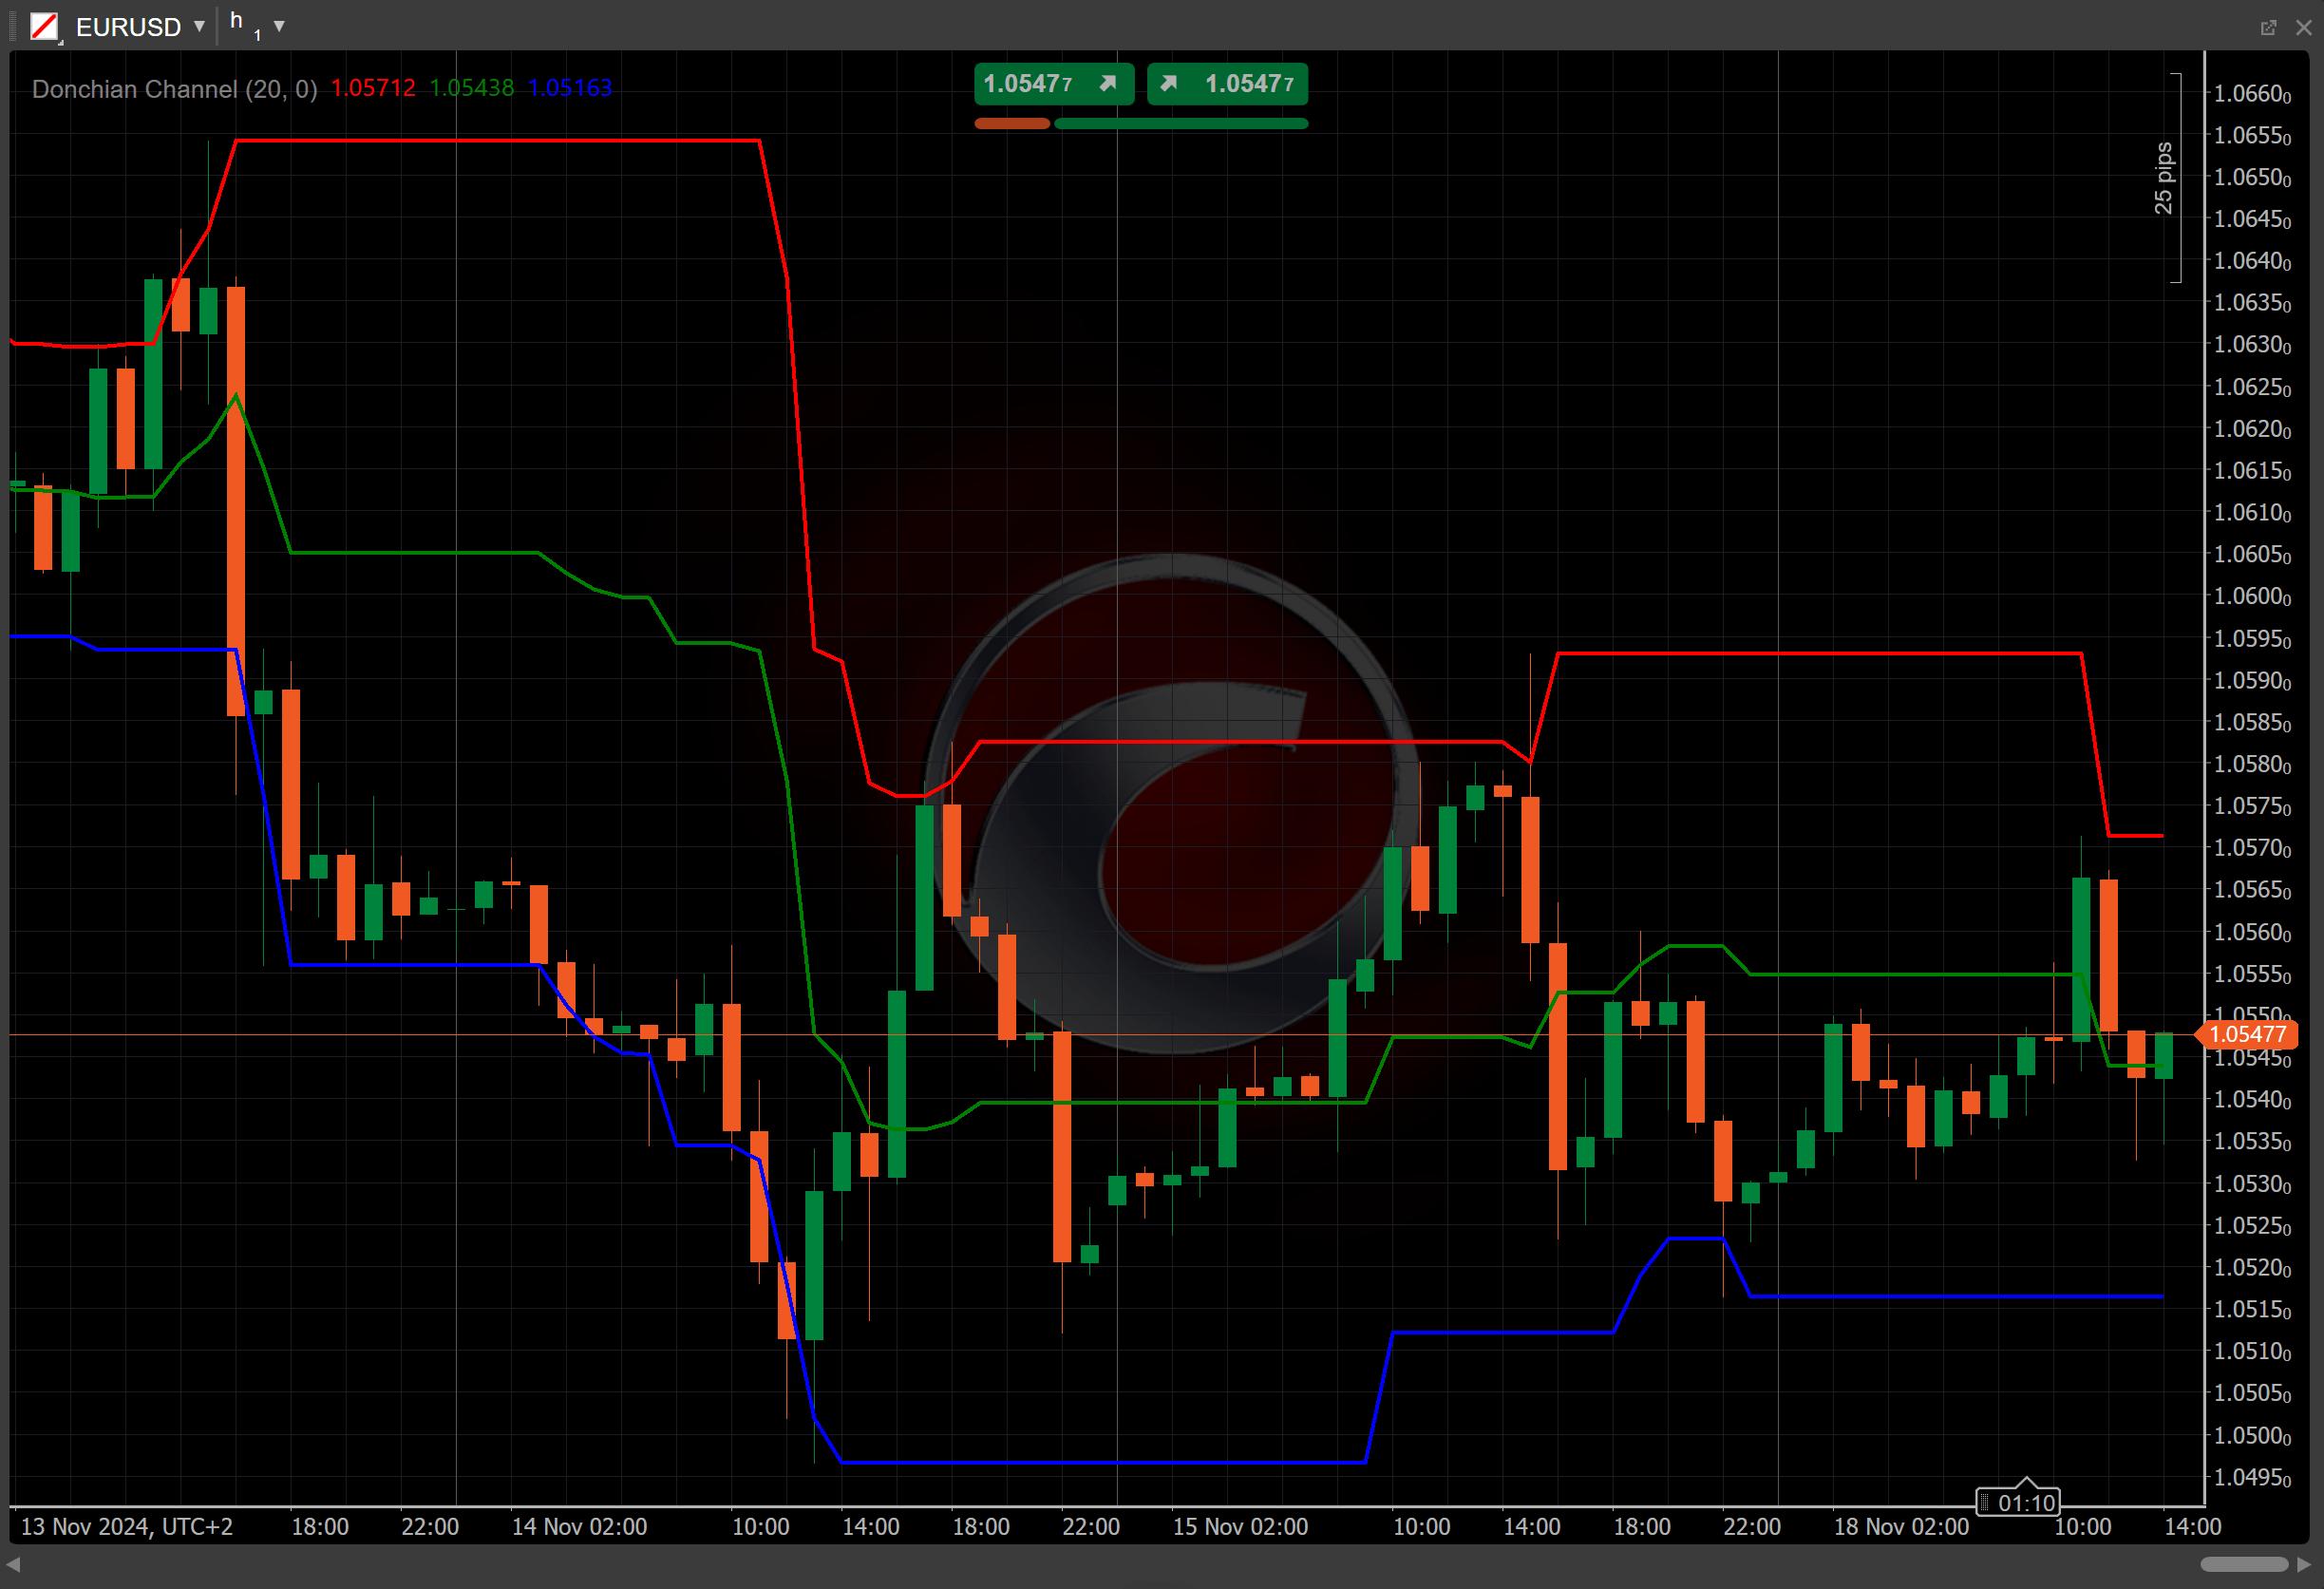
The Donchian Channel is a technical analysis tool used to measure price volatility and identify trends. It consists of three lines: the top channel, the bottom channel and the middle line, which represent the highest high, the lowest low and the average price over a specified period, respectively. These channels help traders assess potential breakout points and reversals by observing price movements within or outside the channels.
History
The Donchian Channel was developed by Richard Donchian, a pioneer in technical analysis and one of the early advocates of systematic trend-following strategies. He introduced the concept in the 1970s as part of his broader work on trend-following systems. Donchian's contributions laid the foundation for many modern trend-following techniques used today.
Calculations
Donchian Channels are calculated by identifying the highest high and lowest low over a specified period, with the middle line as their average.
- Top band – the highest price over the past \(n\) periods.
\[ Top = { max\ (High\ (n)) } \]
- Bottom band – the lowest price over the past \(n\) periods.
\[ Bottom = { min\ (Low\ (n)) } \]
- Middle band – the average of the top and bottom bands.
\[ Middle = { { Top + Bottom } \over 2 } \]
Interpretation
Donchian Channels are calculated over a specified period, typically 20 days. They help to identify breakouts, trend reversals and volatility levels.
-
Breakouts – price closing above the top channel indicates a potential buy signal or bullish breakout, suggesting the asset might enter an upward trend. Price closing below the bottom channel indicates a potential sell signal or bearish breakout, suggesting the asset might enter a downward trend.
-
Trend confirmation – rising top and bottom channels confirm an upward trend. Falling top and bottom channels confirm a downward trend. Flat channels indicate a sideways or range-bound market.
-
Volatility analysis – wider channels indicate higher volatility in the market. Narrower channels indicate lower volatility and potential consolidation.
-
Shift – by adjusting the shift parameter to alter the alignment of the Donchian Channel indicator with price data on the chart, you can explore how the Donchian Channel readings correspond to past or future price movements.
Application
The Donchian Channel can be applied in several ways.
-
Buy signal – traders might consider entering a buy position when the price breaks above the top band, signalling potential upward momentum.
-
Sell signal – a sell position could be indicated when the price falls below the bottom band, signalling potential downward momentum.
-
Stop-loss placement – traders may place stop-loss levels just below the bottom band for long positions or above the top band for short positions to manage risk.
Note
You can take advantage of algo trading, with cBots executing trades based on the signals from this indicator, as shown in our examples. Learn more about how to use indicators in cBots.
Limitations
The Donchian Channel is based on historical price data and may provide delayed signals in rapidly changing markets. It may generate false breakouts in range-bound or choppy markets. Additionally, the channels provide no information on the strength of a trend, only the direction.
Summary
The Donchian Channel is a trend-following indicator that helps traders identify potential breakouts, trends and volatility levels by plotting the highest high, lowest low and the middle line over a specified period. It is particularly useful for identifying entry and exit points in trending markets.