Fractal Chaos Bands
Definition
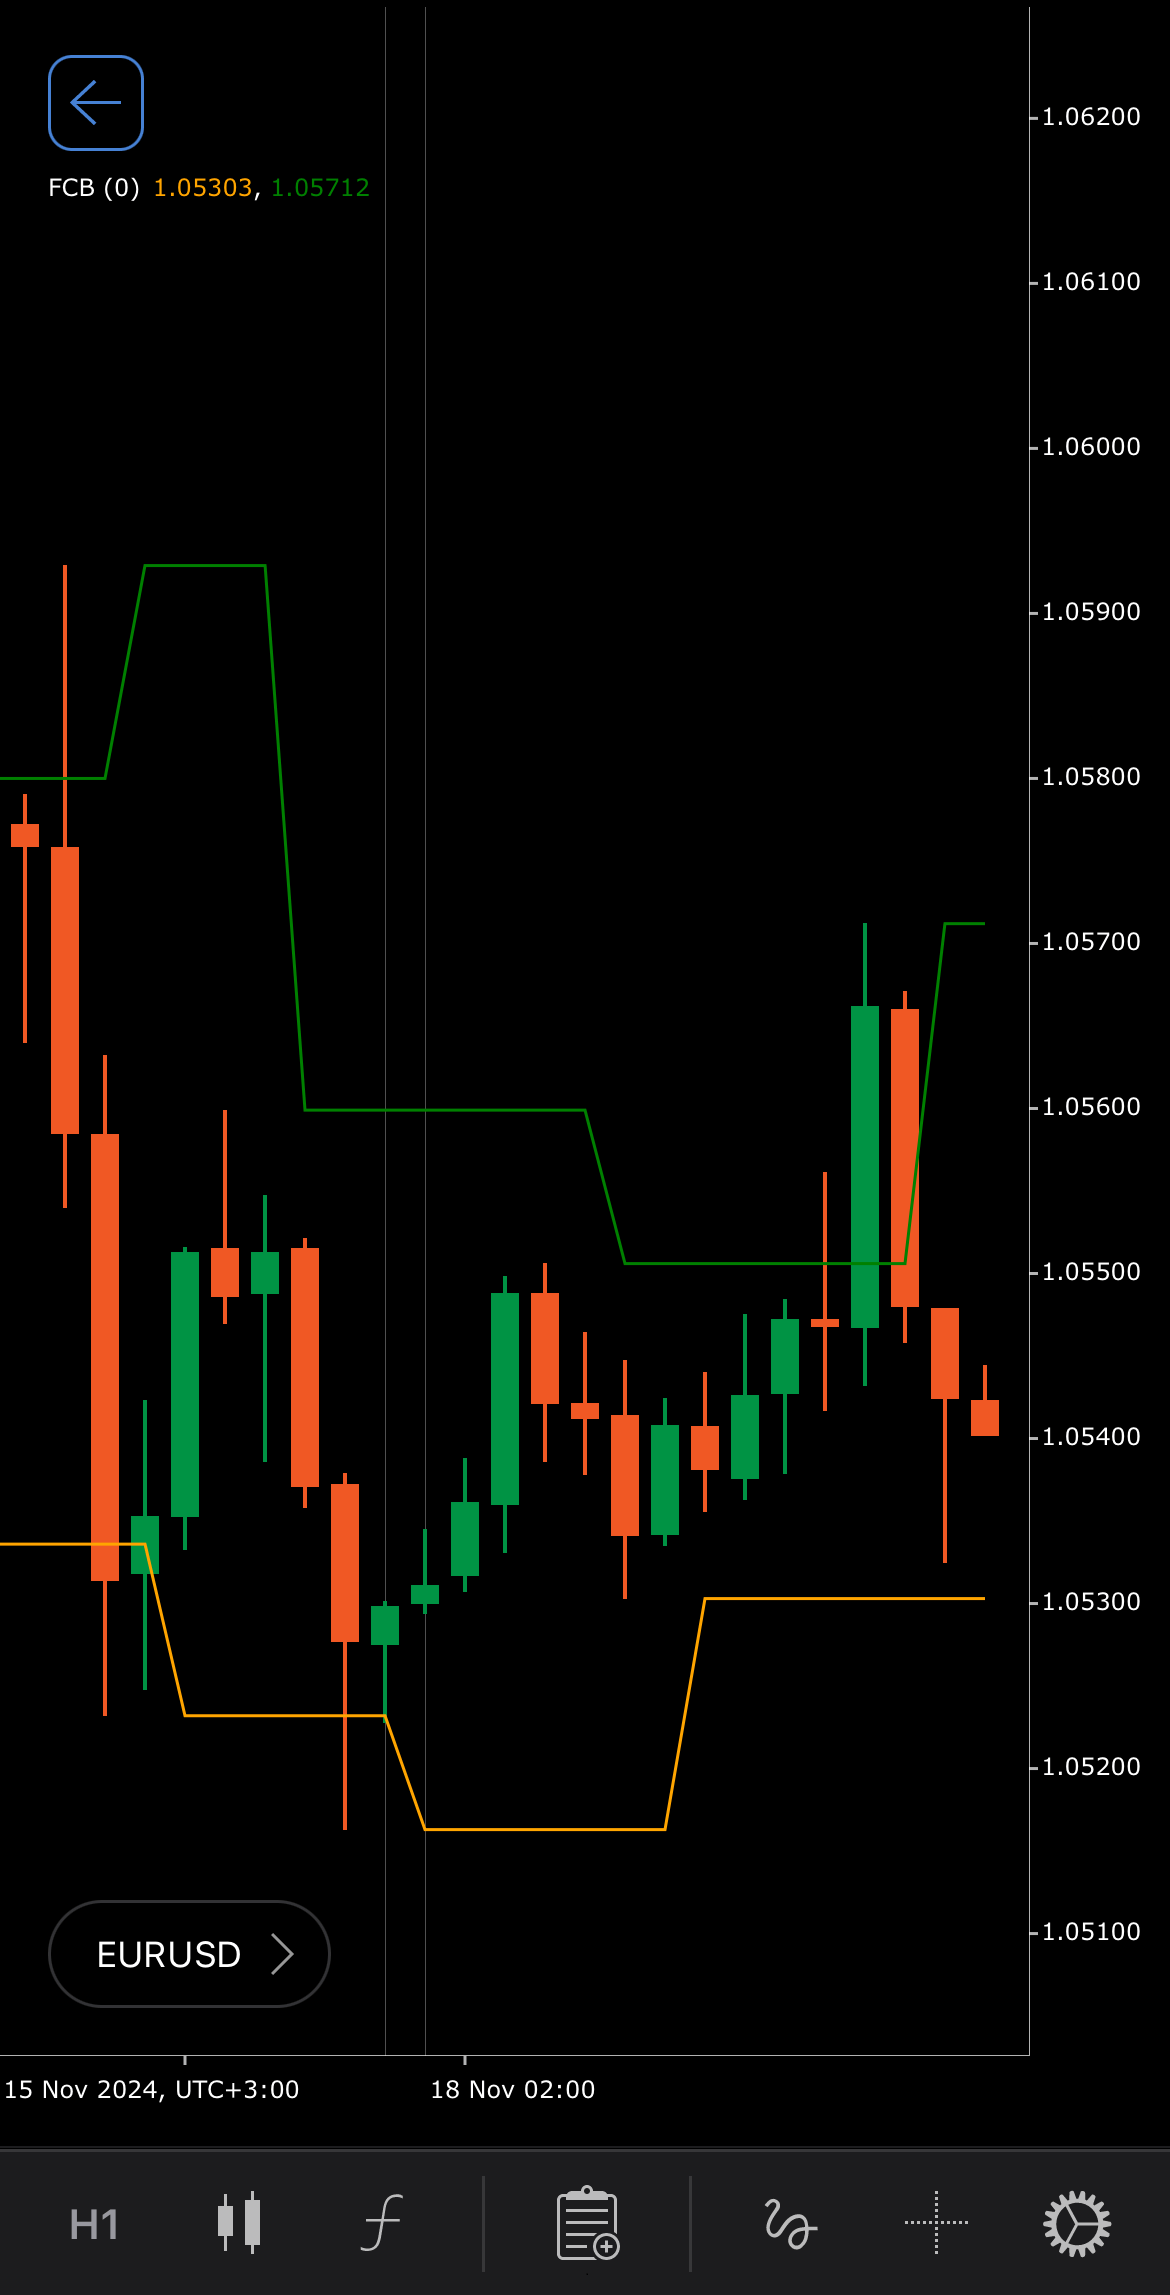
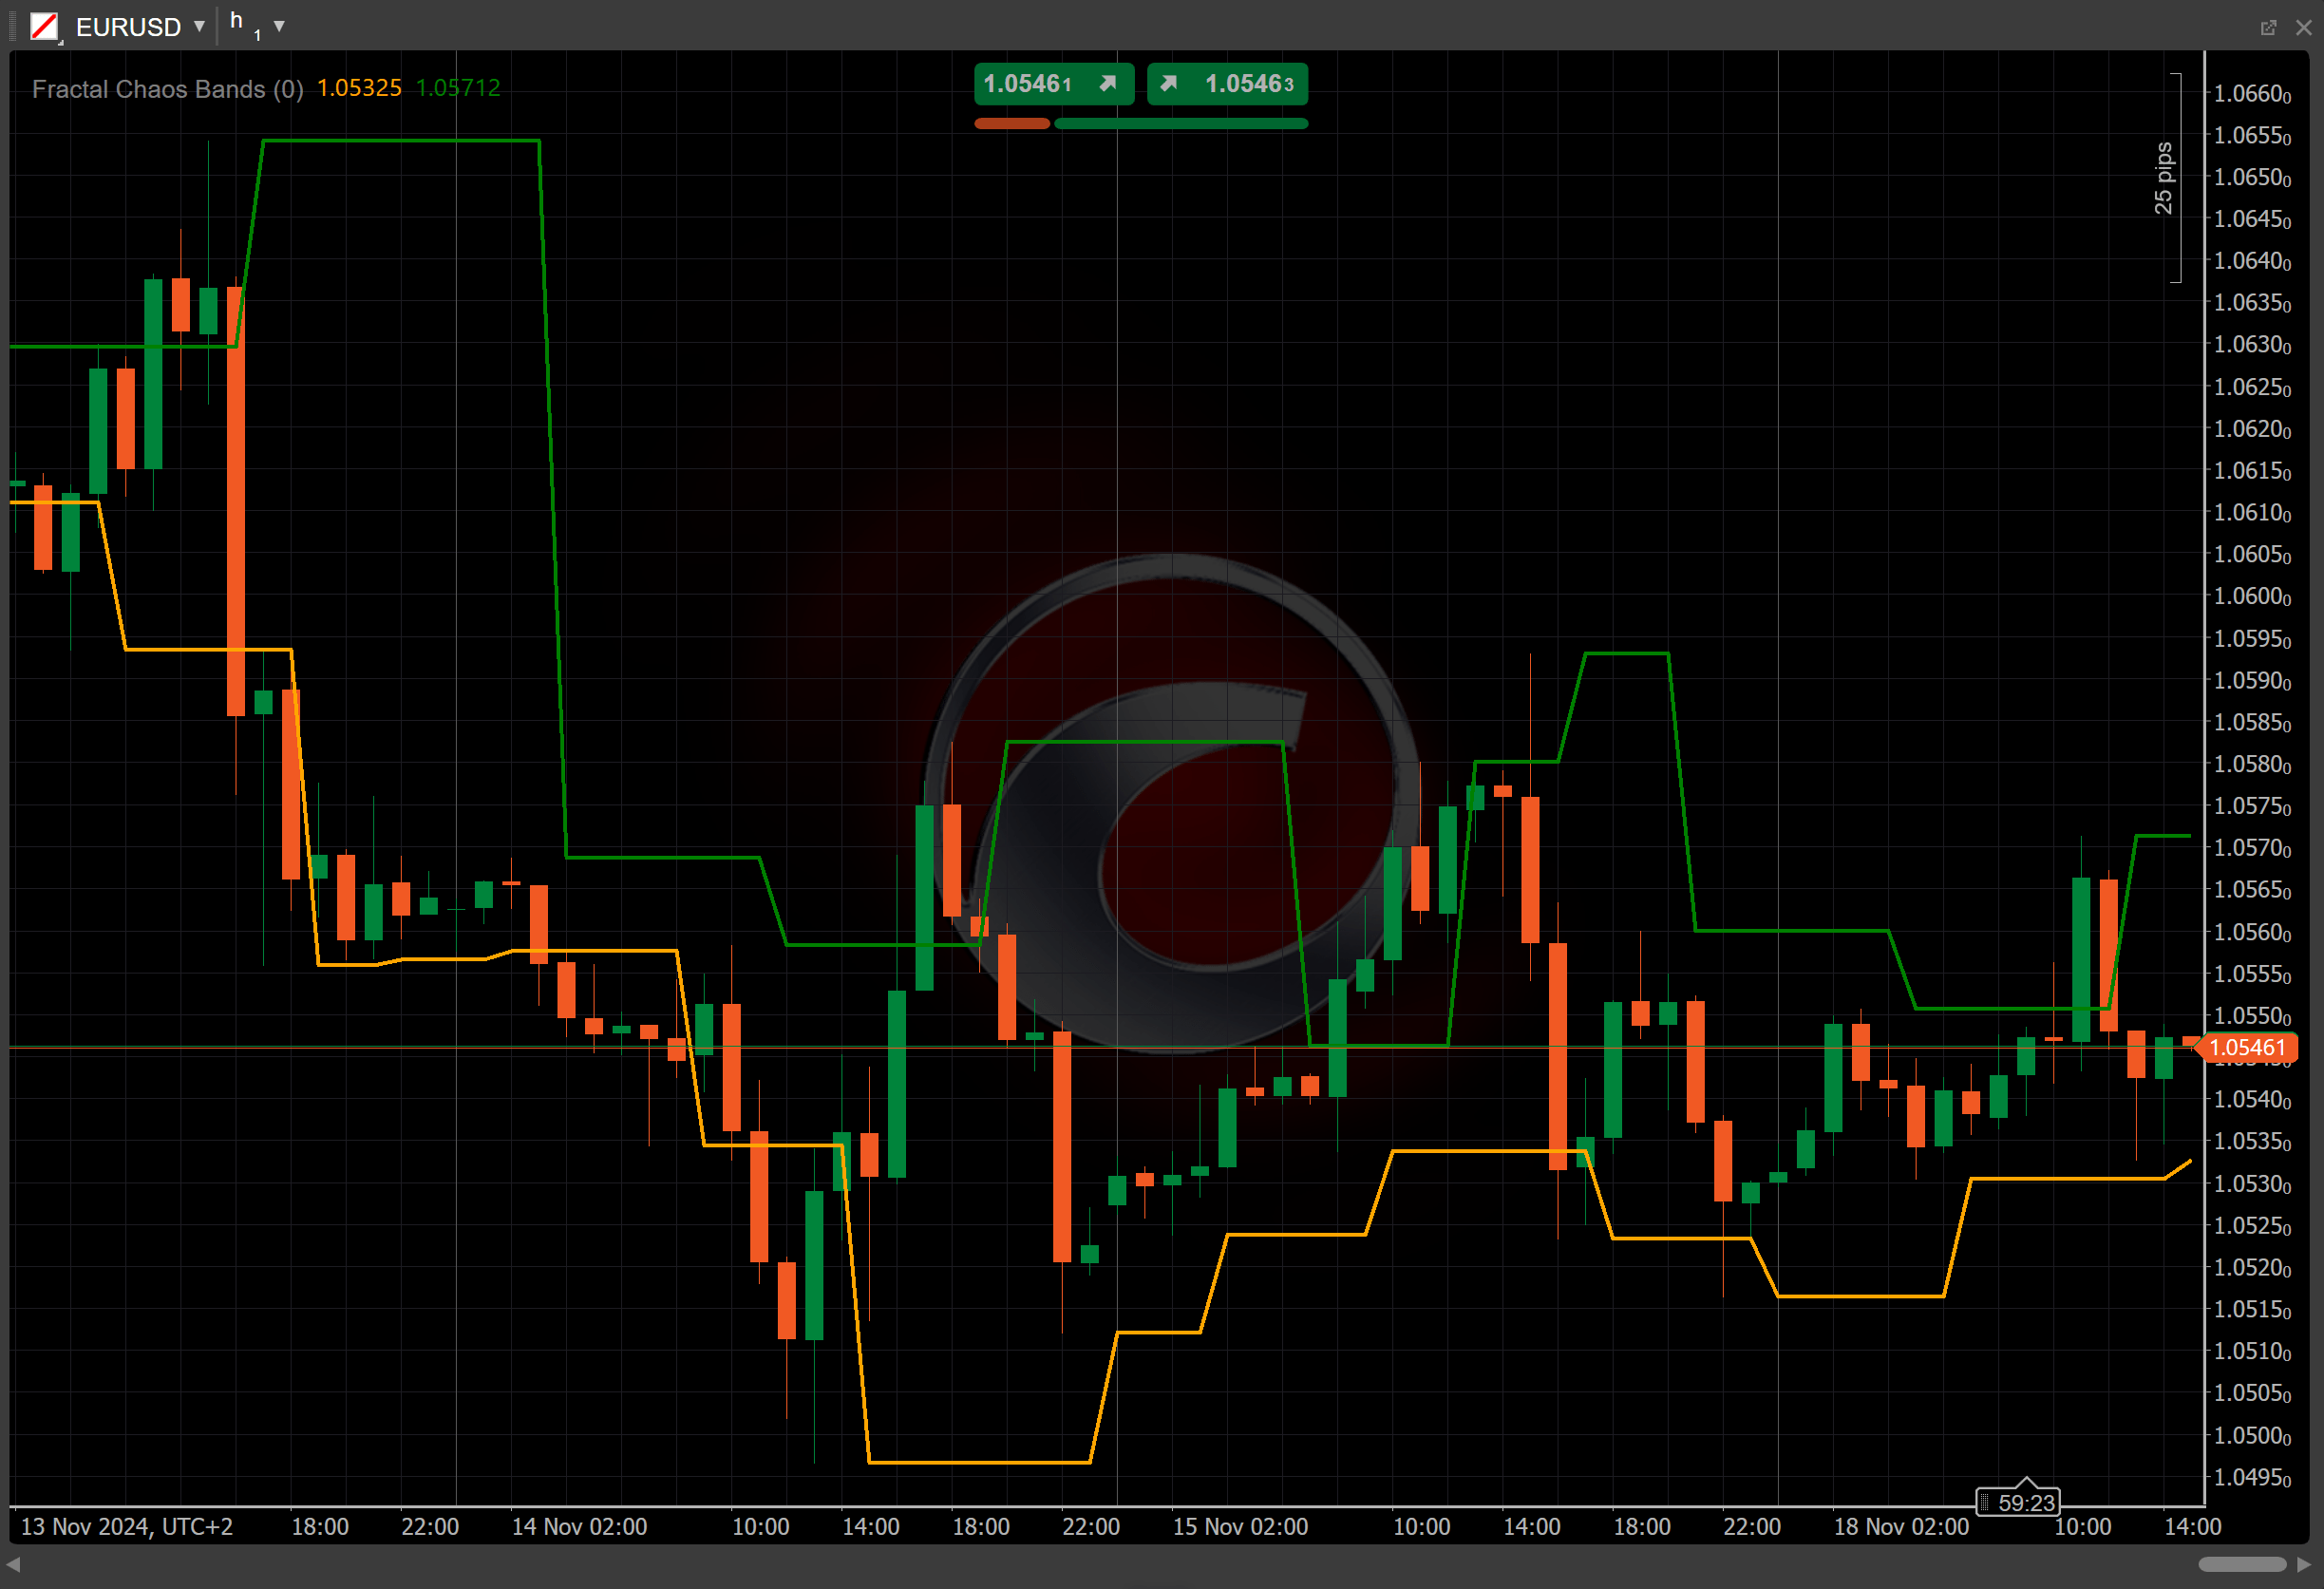
The Fractal Chaos Bands (FCB) indicator is a volatility-based tool designed to identify price trends and potential reversals by marking key high and low points in the market using fractals. These fractals are created by examining recent price extremes and the bands help highlight market direction, distinguishing between trending and ranging (sideways) market conditions.
History
The Fractal Chaos Bands indicator is inspired by fractal geometry, introduced by Benoît Mandelbrot, which is applied to finance and market price movements. The indicator utilises fractals to represent repetitive patterns in the price structure and to detect market trends. Its development is influenced by the use of fractals in various trading strategies that analyse price behaviour through self-similar patterns at different periods.
Calculations
The calculation of the Fractal Chaos Bands involves identifying the most recent fractals; specific points where the price forms a local high (high fractal) or local low (low fractal). The bands are formed by plotting these fractal points across the chart, creating a boundary between upper and lower price levels.
-
High fractal – is determined when the current price is higher than the surrounding prices over a defined period.
-
Low fractal – is calculated when the current price is lower than the surrounding prices over a defined period.
The bands adjust dynamically as new fractals are identified, with the upper band following the high fractals and the lower band following the low fractals.
Interpretation
-
Breakouts – price breaking the upper band suggests potential bullish momentum and the possibility of an uptrend. Price breaking the lower band suggests potential bearish momentum and the possibility of a downtrend.
-
Trend identification – when bands slope upward it indicates an uptrend. When bands slope downward it indicates a downtrend.
-
Sideways movement – when the bands move horizontally without significant slope, it signals a range-bound or consolidating market.
-
Shift – by adjusting the shift parameter to alter the alignment of the Fractal Chaos Bands with price data on the chart, you can explore how the indicator readings correspond to past or future price movements.
Application
-
Buy signal – traders might consider buying when the price approaches the lower band, as this could indicate oversold conditions and a potential upward reversal.
-
Sell signal – a sell signal might be triggered when the price moves towards the upper band, signalling overbought conditions or a potential reversal downward.
-
Breakouts – when the price breaks above the upper band or below the lower band, it could signal the start of a new trend, offering a trading opportunity in the direction of the breakout.
-
Combining with other indicators – to increase the reliability of signals, traders often use the Fractal Chaos Bands with other indicators such as the Relative Strength Index (RSI) for momentum or the moving average to confirm trend direction and filter out false signals during consolidation phases.
Note
You can take advantage of algo trading, with cBots executing trades based on the signals from this indicator, as shown in our examples. Learn more about how to use indicators in cBots.
Limitations
The Fractal Chaos Bands indicator may lag during periods of extreme volatility, or when markets are moving quickly due to its reliance on historical price data to identify fractals. In addition, during range-bound or choppy markets, the bands may generate false signals.
Summary
The Fractal Chaos Bands provide a unique way to visualise market trends and volatility by tracking price extremes using fractals. The bands highlight potential trend directions and reversal points, making them useful for both trend-following and range-bound strategies. The indicator relies on fractals, points where the price forms a local high or local low. This helps represent repetitive patterns in the price structure and detect market trends.