Keltner Channels
Definition
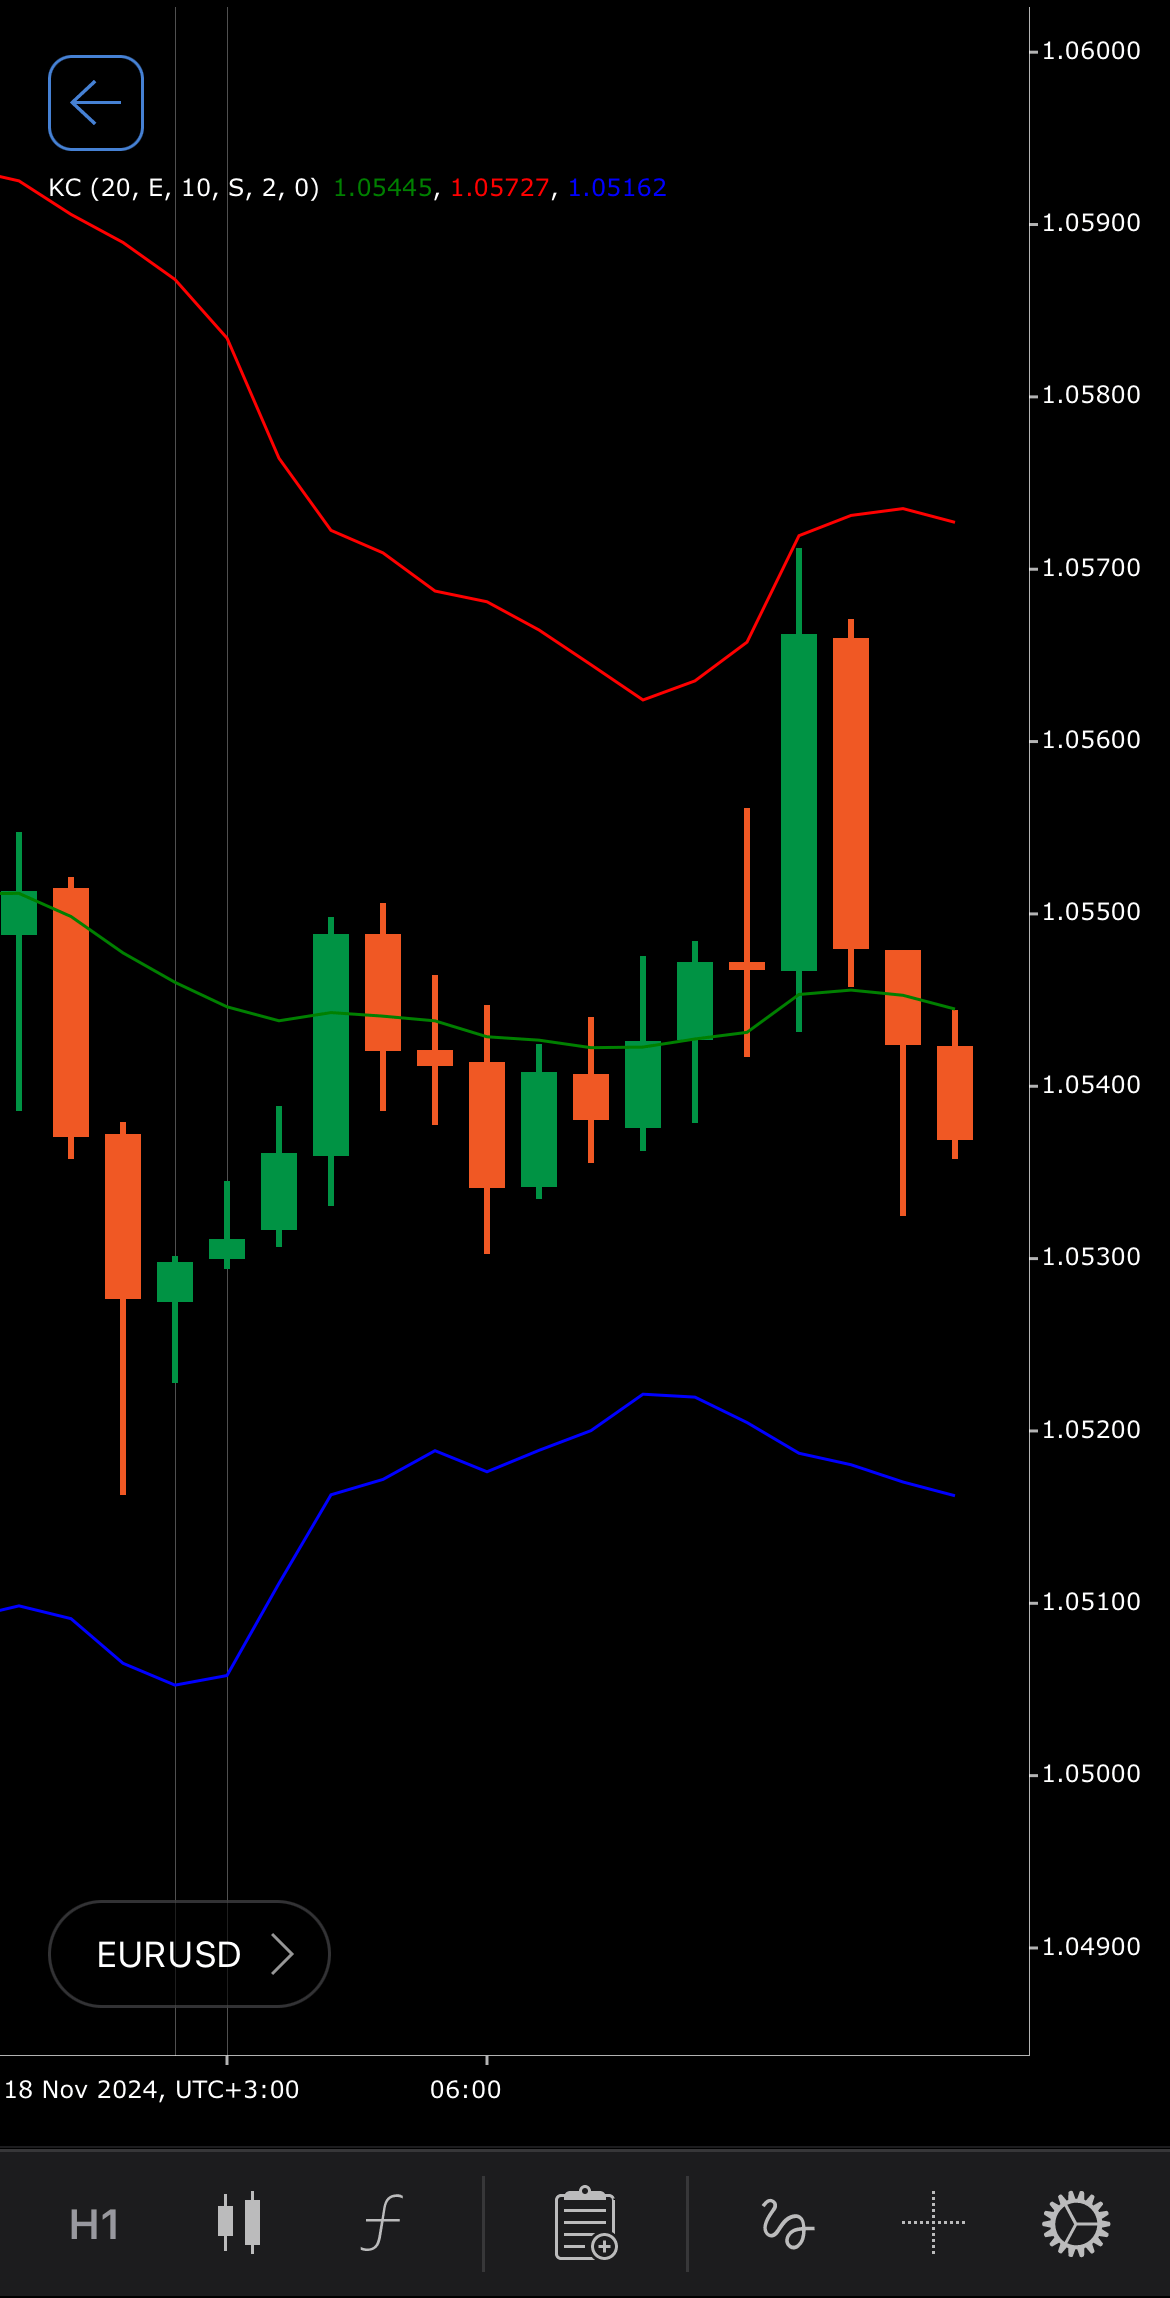
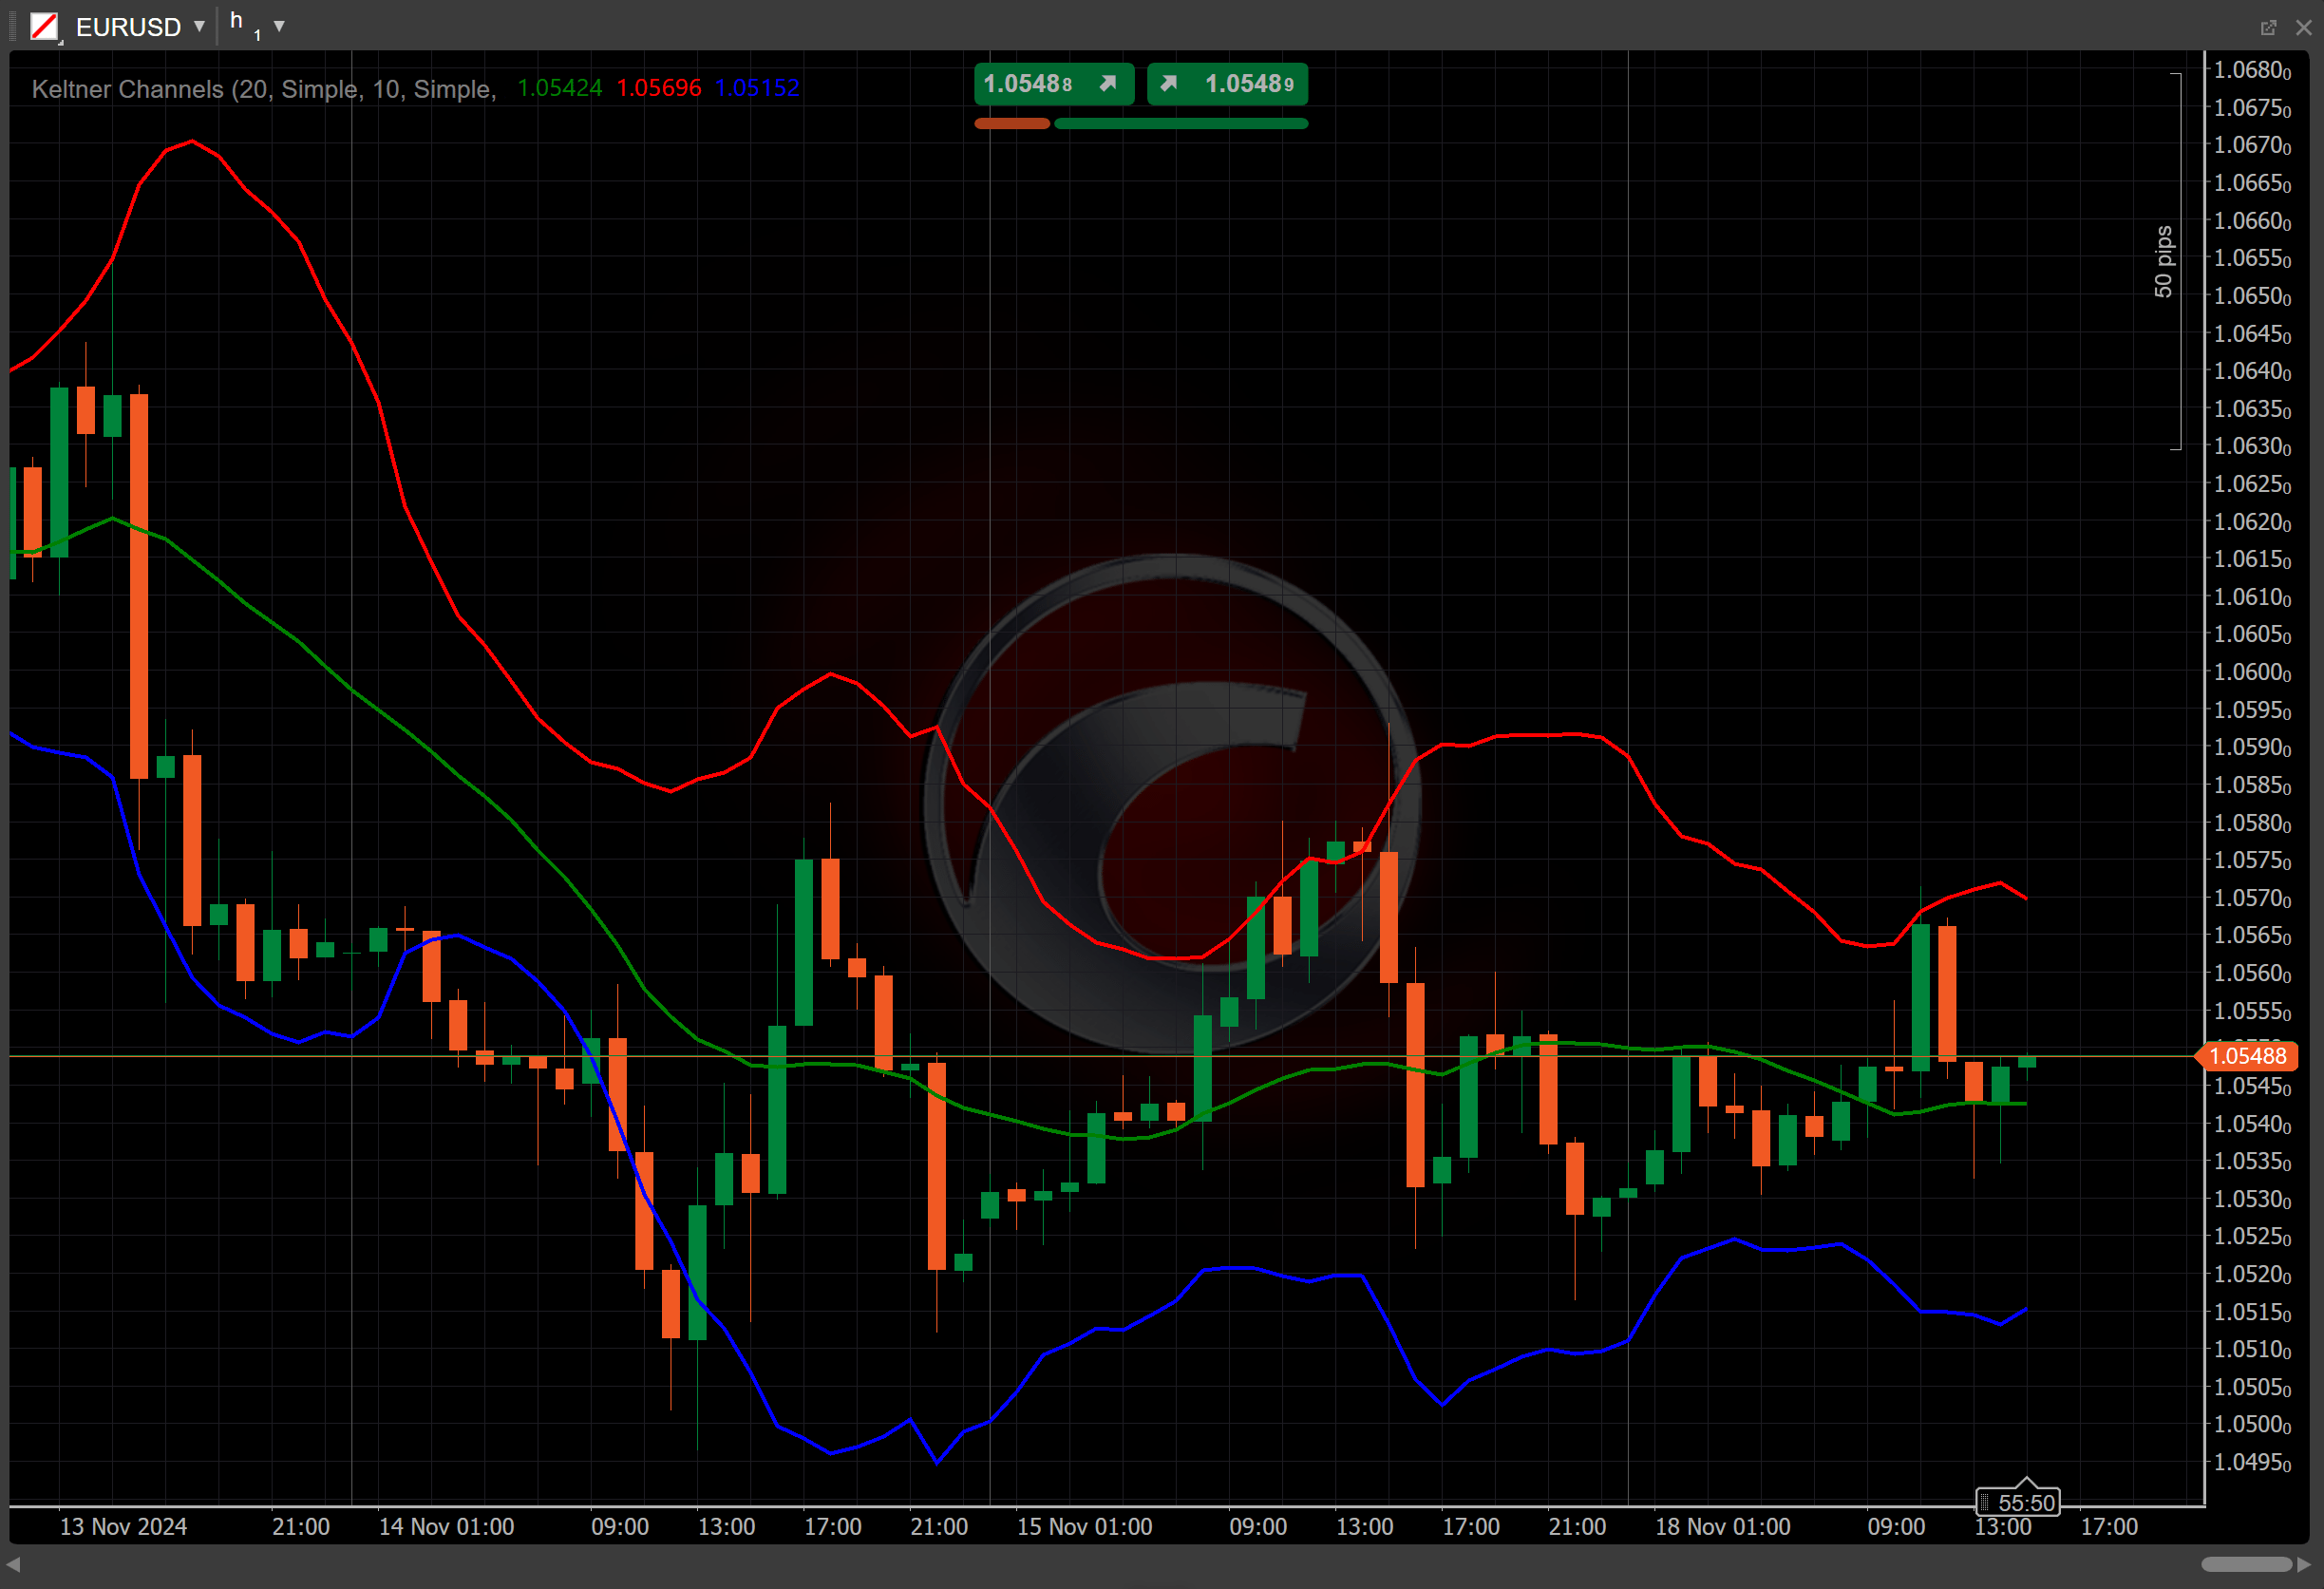
The Keltner Channels indicator is a volatility-based tool used in technical analysis to identify potential trend directions and price reversals. Composed of a central moving average with two bands set above and below, the Keltner Channels expand and contract based on the Average True Range (ATR), highlighting periods of high and low volatility.
History
Chester W. Keltner, a commodities trader, first introduced the Keltner Channels in the 1960s. Originally based on a 10-day moving average and typical price, modern versions incorporate the different moving averages and the ATR values for enhanced accuracy in trend and reversal detection.
Calculations
The Keltner Channels are calculated using three elements.
- Middle band – the moving average of the closing price over the specified MA period using the chosen MA type.
\[ Main = { MA\ ( Close,\ MAPeriod,\ MAType ) } \]
- Top band – calculated by adding the product of the band distance and the ATR to the middle band.
\[ Top = { Main + (BandDistance \times ATR) } \]
- Bottom band – calculated by subtracting the product of the band distance and the ATR from the middle band.
\[ Bottom = { Main - (BandDistance \times ATR) } \]
\(BandDistance\) – the band distance multiplier, which adjusts the width of the channels
\(ATR\) – the Average True Range, given over the specified ATR period using the chosen ATR MA type
Interpretation
The default parameter values for the Keltner Channels calculation are as follows:
-
The default number of periods for MA calculation is 20, with the Simple Moving Average (SMA) as the default type of MA.
-
The default number of periods for ATR calculation is 10, with the SMA as the default type of ATR MA.
-
The default band distance value is set to 2.
The main patterns of the indicator behaviour can be interpreted as follows:
-
Price breakouts – breaking out above the upper band shows a potential overbought condition or breakout, possibly signalling an upward trend. Breaking out below the lower band shows a potential oversold condition or breakout, possibly indicating a downward trend.
-
Trend direction – sustained movement near the upper band generally indicates an uptrend. Sustained movement near the lower band suggests a downtrend.
-
Reversals – divergences, where the price and the indicator direction differ, can signal potential reversals.
-
Shift – by adjusting the shift parameter to alter the alignment of the Keltner Channels with price data on the chart, you can explore how the indicator readings correspond to past or future price movements.
Application
-
Buy signal – consider entering a buy position when the price breaks above the upper channel, signalling strong bullish momentum.
-
Sell signal – a sell position may be considered when the price breaks below the lower channel, indicating bearish momentum.
-
Stop-loss placement – traders can place a stop loss just outside the opposite channel line to manage risk during potential reversals.
Note
You can take advantage of algo trading, with cBots executing trades based on the signals from this indicator, as shown in our examples. Learn more about how to use indicators in cBots.
Limitations
The Keltner Channels can produce misleading signals in sideways or low-volatility markets. The indicator may also lag during rapid price changes due to its reliance on historical data. These factors make it susceptible to false signals in choppy conditions, particularly when used alone.
Summary
The Keltner Channels is a volatility-based tool that uses a central moving average and two bands derived from the Average True Range to identify trends, price reversals and overbought or oversold conditions. Movements near the upper or lower bands highlight potential trend strength or shifts, while the central band acts as a trend indicator. Useful in trending markets, the Keltner Channels allow traders to identify breakout opportunities and gauge market volatility effectively.