Chaikin Money Flow
Definition
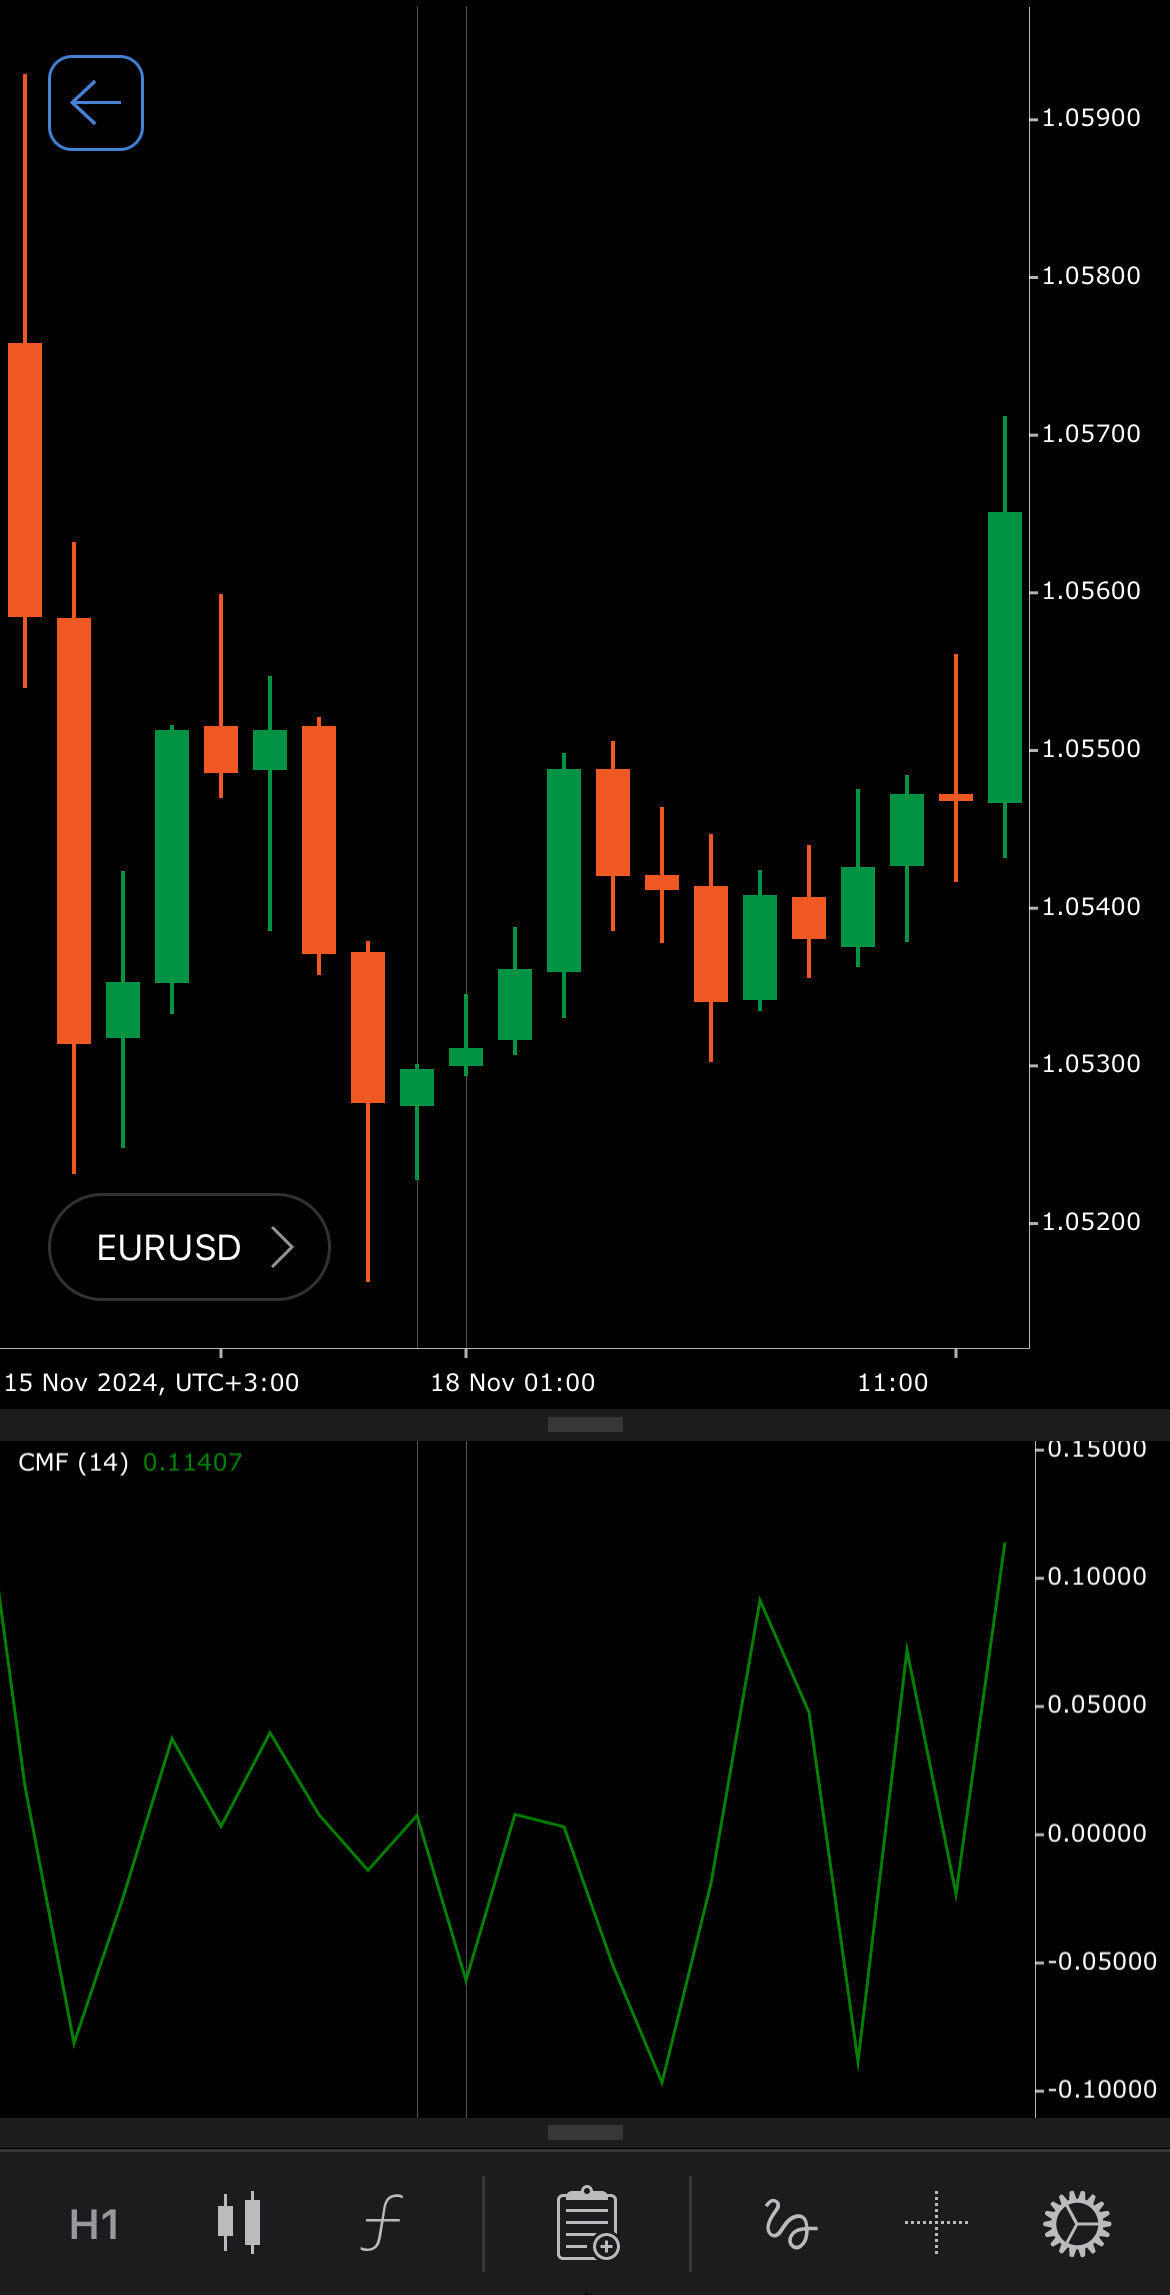
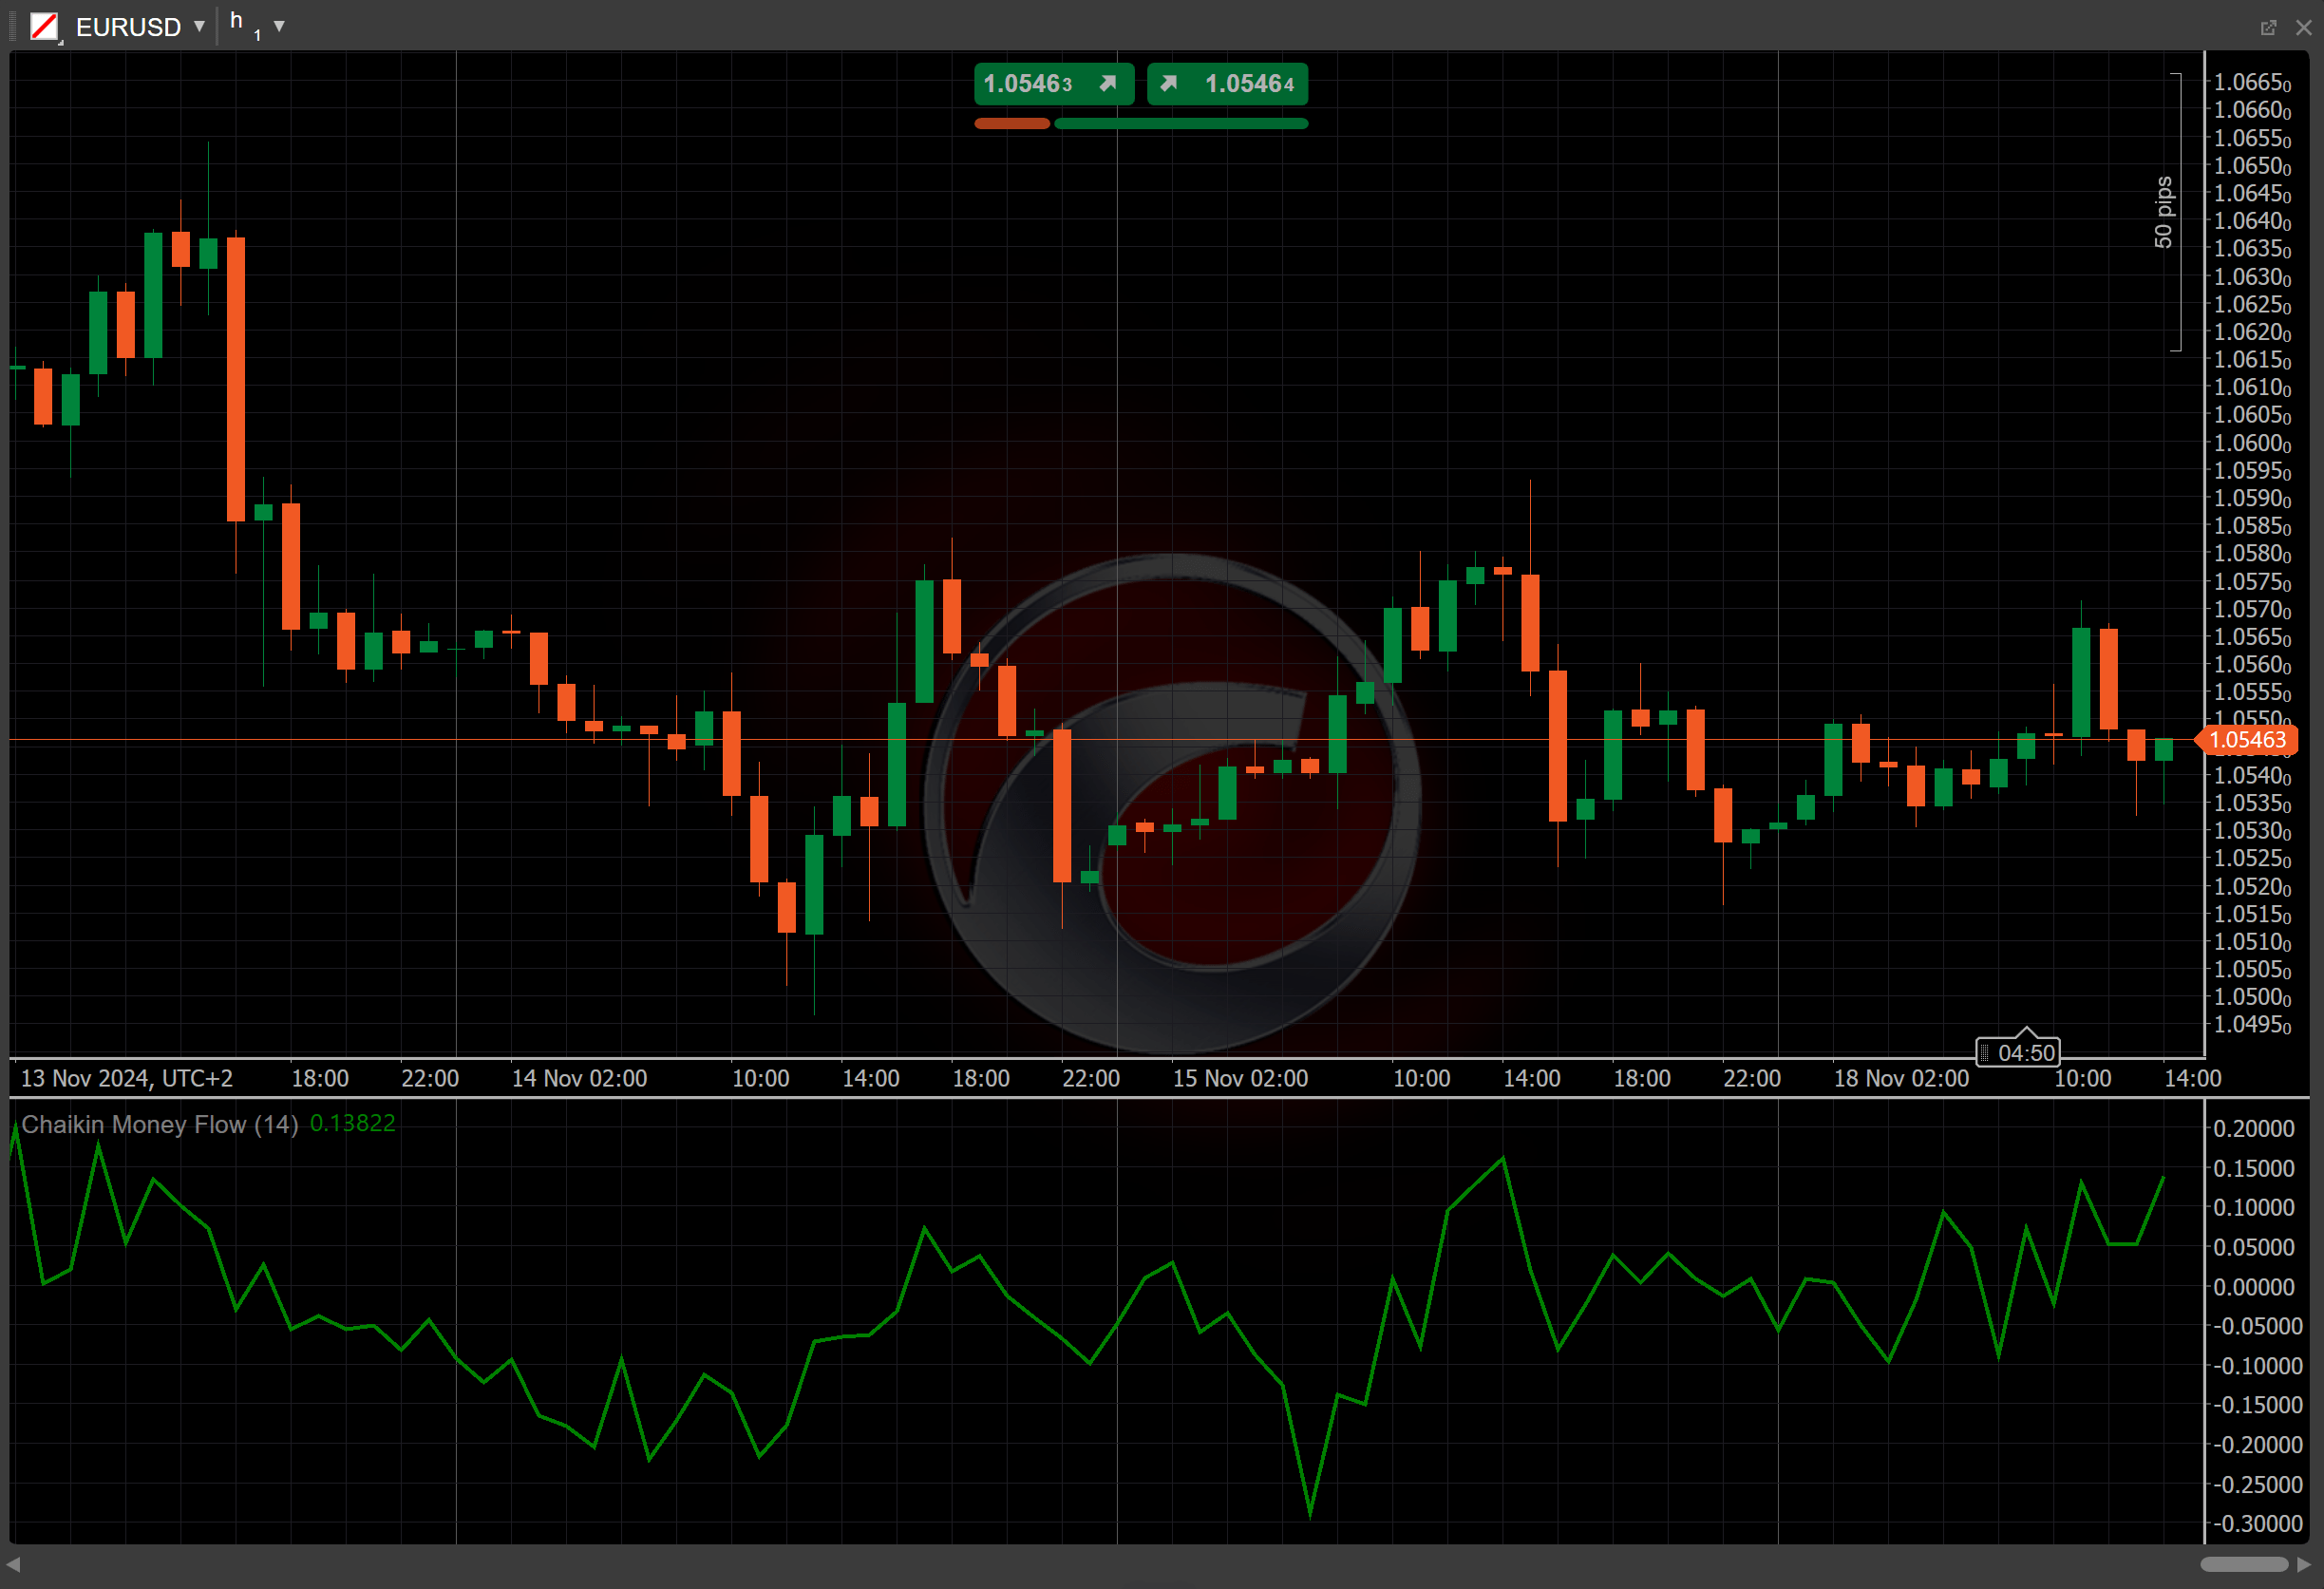
The Chaikin Money Flow (CMF) indicator combines price and volume to measure the buying and selling pressure in a market over a specific period. The CMF aims to quantify the flow of money into and out of a security, providing insights into the strength of trends and potential reversals.
History
The CMF was developed by Marc Chaikin, a well-known trader, market analyst and developer of various trading tools and indicators, including the Chaikin Oscillator and the Chaikin Power Gauge. Marc Chaikin developed the indicator in the 1980s and featured it in his book "Chaikin Analytics: A New Approach to Trading".
Calculations
1. The Money Flow Multiplier (MFM) is defined as the relative position of the closing price within the high-low range for a given period.
\[ MFM = { { ( Close - Low ) - ( High - Close) } \over { High - Low } } \]
2. The Money Flow Volume (MFV) is calculated by multiplying the MFM by the volume.
\[ MFV = { MFM \times Volume } \]
3. The Chaikin Money Flow is the sum of the MFV divided by the volume over the chosen period (by default, 14).
\[ CMF = { { \sum_{i=1}^n { MFV_i } } \over { \sum_{i=1}^n { Volume_i } } } \]
\(High\) and \(Low\) – the current high and low prices
\(Close\) – the previous closing price
\(n\) – the number of periods
Interpretation
-
Zero-line crossovers – a crossover of the CMF line above the zero line indicates that buying pressure is stronger than selling pressure, suggesting potential upward momentum. A crossover below the zero line signals that selling pressure is greater, indicating potential downward momentum.
-
Divergence – if the price is making lower lows while the CMF is making higher lows, this may signal weakening selling pressure and a potential reversal to the upside. If the price is making higher highs while the CMF is making lower highs, this suggests weakening buying pressure and a potential reversal to the downside.
-
Strength of the indicator – the distance of the CMF from the zero line can indicate the strength of the buying or selling pressure. Larger values suggest stronger momentum, while values closer to zero indicate weakening momentum.
-
Trend confirmation – traders often use the CMF in conjunction with price action and other indicators. A rising CMF in an uptrend can confirm the strength of the trend, while a declining CMF in a downtrend may indicate the trend is weakening.
Application
-
Buy signal – traders may consider entering a buy position when the CMF crosses above the zero line, signalling increasing buying pressure.
-
Sell signal – a sell signal can occur when the CMF crosses below the zero line, indicating increasing selling pressure.
-
Stop-loss placement – traders can use the CMF to set stop losses by assessing the strength of momentum and placing stop losses in accordance with shifts in buying or selling pressure.
-
Exit strategies – divergences between the price and the CMF values can serve as signals to exit positions, especially when momentum starts to weaken.
Note
You can take advantage of algo trading, with cBots executing trades based on the signals from this indicator, as shown in our examples. Learn more about how to use indicators in cBots.
Limitations
The CMF may produce signal delays in fast-moving markets. Rapid price movements may lead to erratic readings, especially in volatile or choppy markets. Additionally, the effectiveness of the CMF can be highly sensitive to the selected period of calculation.
Summary
The Chaikin Money Flow measures the buying and selling pressure in a market over a specified period, combining price and volume data. A crossover of the CMF line above the zero line indicates that buying pressure is stronger than selling pressure. A crossover below the zero line signals that selling pressure is greater, indicating potential downward momentum. The main purpose of the CMF is to quantify the flow of money into and out of a security, providing insights into the strength of trends and potential reversals.