Ease of Movement
Definition
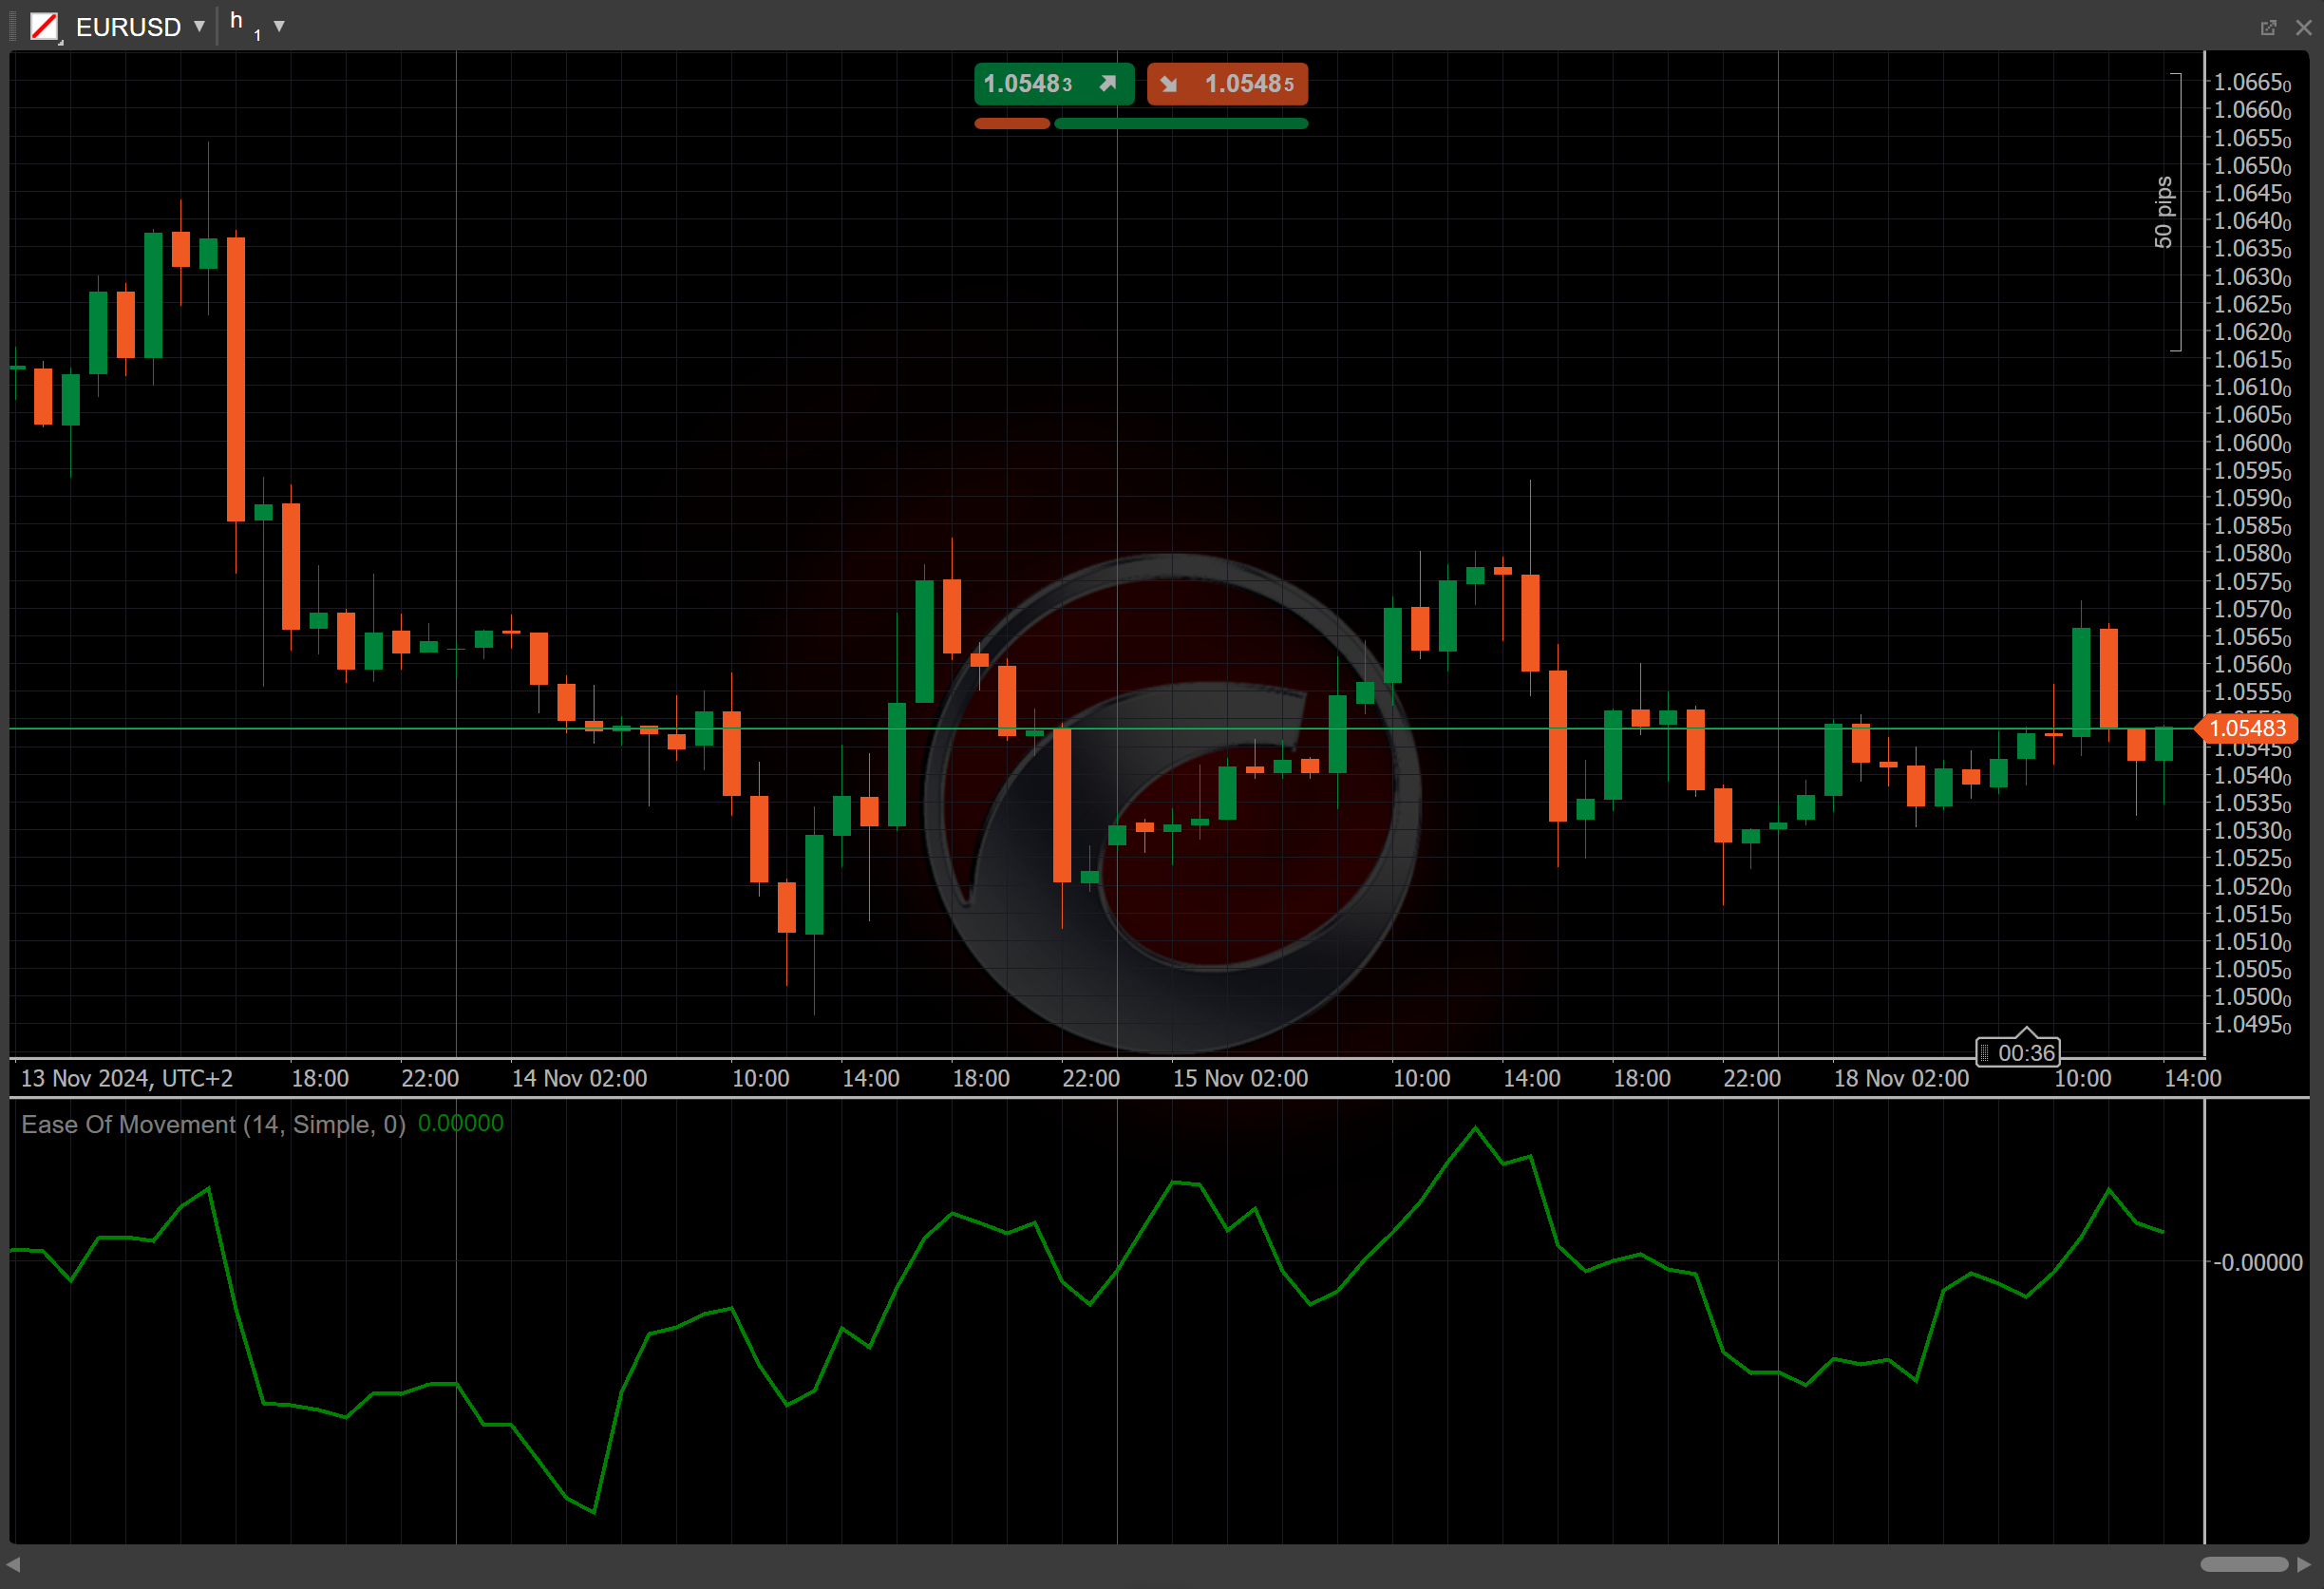
The Ease of Movement (EMV) is a volume-based technical analysis indicator that measures the relationship between price and volume to gauge the ease with which an asset’s price moves. It helps traders identify whether price movements are happening with little or much effort from the market participants.

History
The Ease of Movement was developed by Richard W. Arms in the 1990s. Arms, known for his work on other volume-based indicators such as the Arms Index (TRIN), designed the EMV to combine both price and volume in a straightforward calculation, providing a unique perspective on market momentum.
Calculations
The Ease of Movement formula consists of several components.
First, the midpoints of the high and low prices for the current and previous periods are calculated.
\[ Midpoint = { { High + Low } \over 2 } \]
Then, their difference is divided by the volume and scaled by the current high-low price range.
\[ EMV = { { ( { Midpoint - Midpoint_{prev} } ) } \times { { High - Low } \over Volume } } \]
This is then multiplied by 10,000 to adjust the scale. Finally, the result is smoothed by applying a moving average over the specified period.
Interpretation
-
Value – a positive EMV indicates that prices are rising with ease and buying pressure is dominant. A negative EMV shows that prices are falling easily, suggesting selling pressure.
-
Zero-line crossovers – the zero line acts as a critical threshold. When EMV crosses above zero, it signals a possible start of an upward trend and when it crosses below zero, it indicates potential bearish movement.
-
Divergence – a bullish divergence occurs when the price hits a lower low while the EMV makes a higher low, indicating weakening selling pressure and a potential reversal upward. A bearish divergence happens when the price hits a higher high but the EMV makes a lower high.
Application
-
Buy signal – consider entering a long position when the EMV crosses above the zero line, indicating upward price movement with ease.
-
Sell signal – consider entering a short position when the EMV crosses below the zero line, signalling downward movement with ease.
-
Stop-loss placement – traders might place stop-loss orders below significant support levels for long positions or above resistance levels for short positions to manage risk.
-
Combining with other indicators – traders typically use the EMV with other tools like the Relative Strength Index (RSI) to confirm whether an asset is overbought or oversold or with moving averages to smooth out short-term noise.
Note
You can take advantage of algo trading, with cBots executing trades based on the signals from this indicator, as shown in our examples. Learn more about how to use indicators in cBots.
Limitations
The Ease of Movement can produce false signals in low-volume markets or during periods of market consolidation. It may not always be ideal for predicting short-term reversals, but rather for confirming ongoing trends.
Summary
The Ease of Movement provides insight into how effortlessly price movements occur based on volume. Positive EMV values suggest price rises with relative ease, while negative values signal ease of price declines. As the zero line determines its base value, a crossing over it signals an upward price movement with ease. Alternatively, a crossing below the zero line signals a downward movement with ease.