Negative Volume Index
Definition
The Negative Volume Index (NVI) is a technical analysis indicator that measures price trends based on changes in trading volume. This indicator is often used in conjunction with the Positive Volume Index (PVI) to identify bull markets. It focuses specifically on days when volume decreases, under the premise that informed investors are more likely to trade during these periods. The indicator helps identify long-term market trends and potential reversals.
History
The NVI indicator was first developed by Paul L. Dysart in the 1930s, focusing on the relationship between price movements and trading volume. Dysart theorised that significant price changes occur on days of low trading volume, indicating informed trading. In 1965, Norman G. Fosback popularised the NVI, expanding its application in technical analysis. This indicator has since become essential for traders to identify market trends based on volume dynamics.
Calculations
To begin, the NVI baseline is set to a round number (usually 1000, 100 or 1) on the start date.
If the volume increases in the following period, the NVI for that period will remain the same as that of the previous period. Conversely, if the volume decreases during a given period, the NVI is calculated using the following formula:
\[ NVI_t = NVI_{t-1} + { { {P_t - P_{t-1} } \over P_{t-1} } \times NVI_{t-1} } \]
\(NVI_t\) – the Negative Volume Index for the current period
\(NVI_{t-1}\) – the Negative Volume Index for the previous period
\(P_t\) – the closing price for the current period
\(P_{t-1}\) – the closing price for the previous period
Interpretation
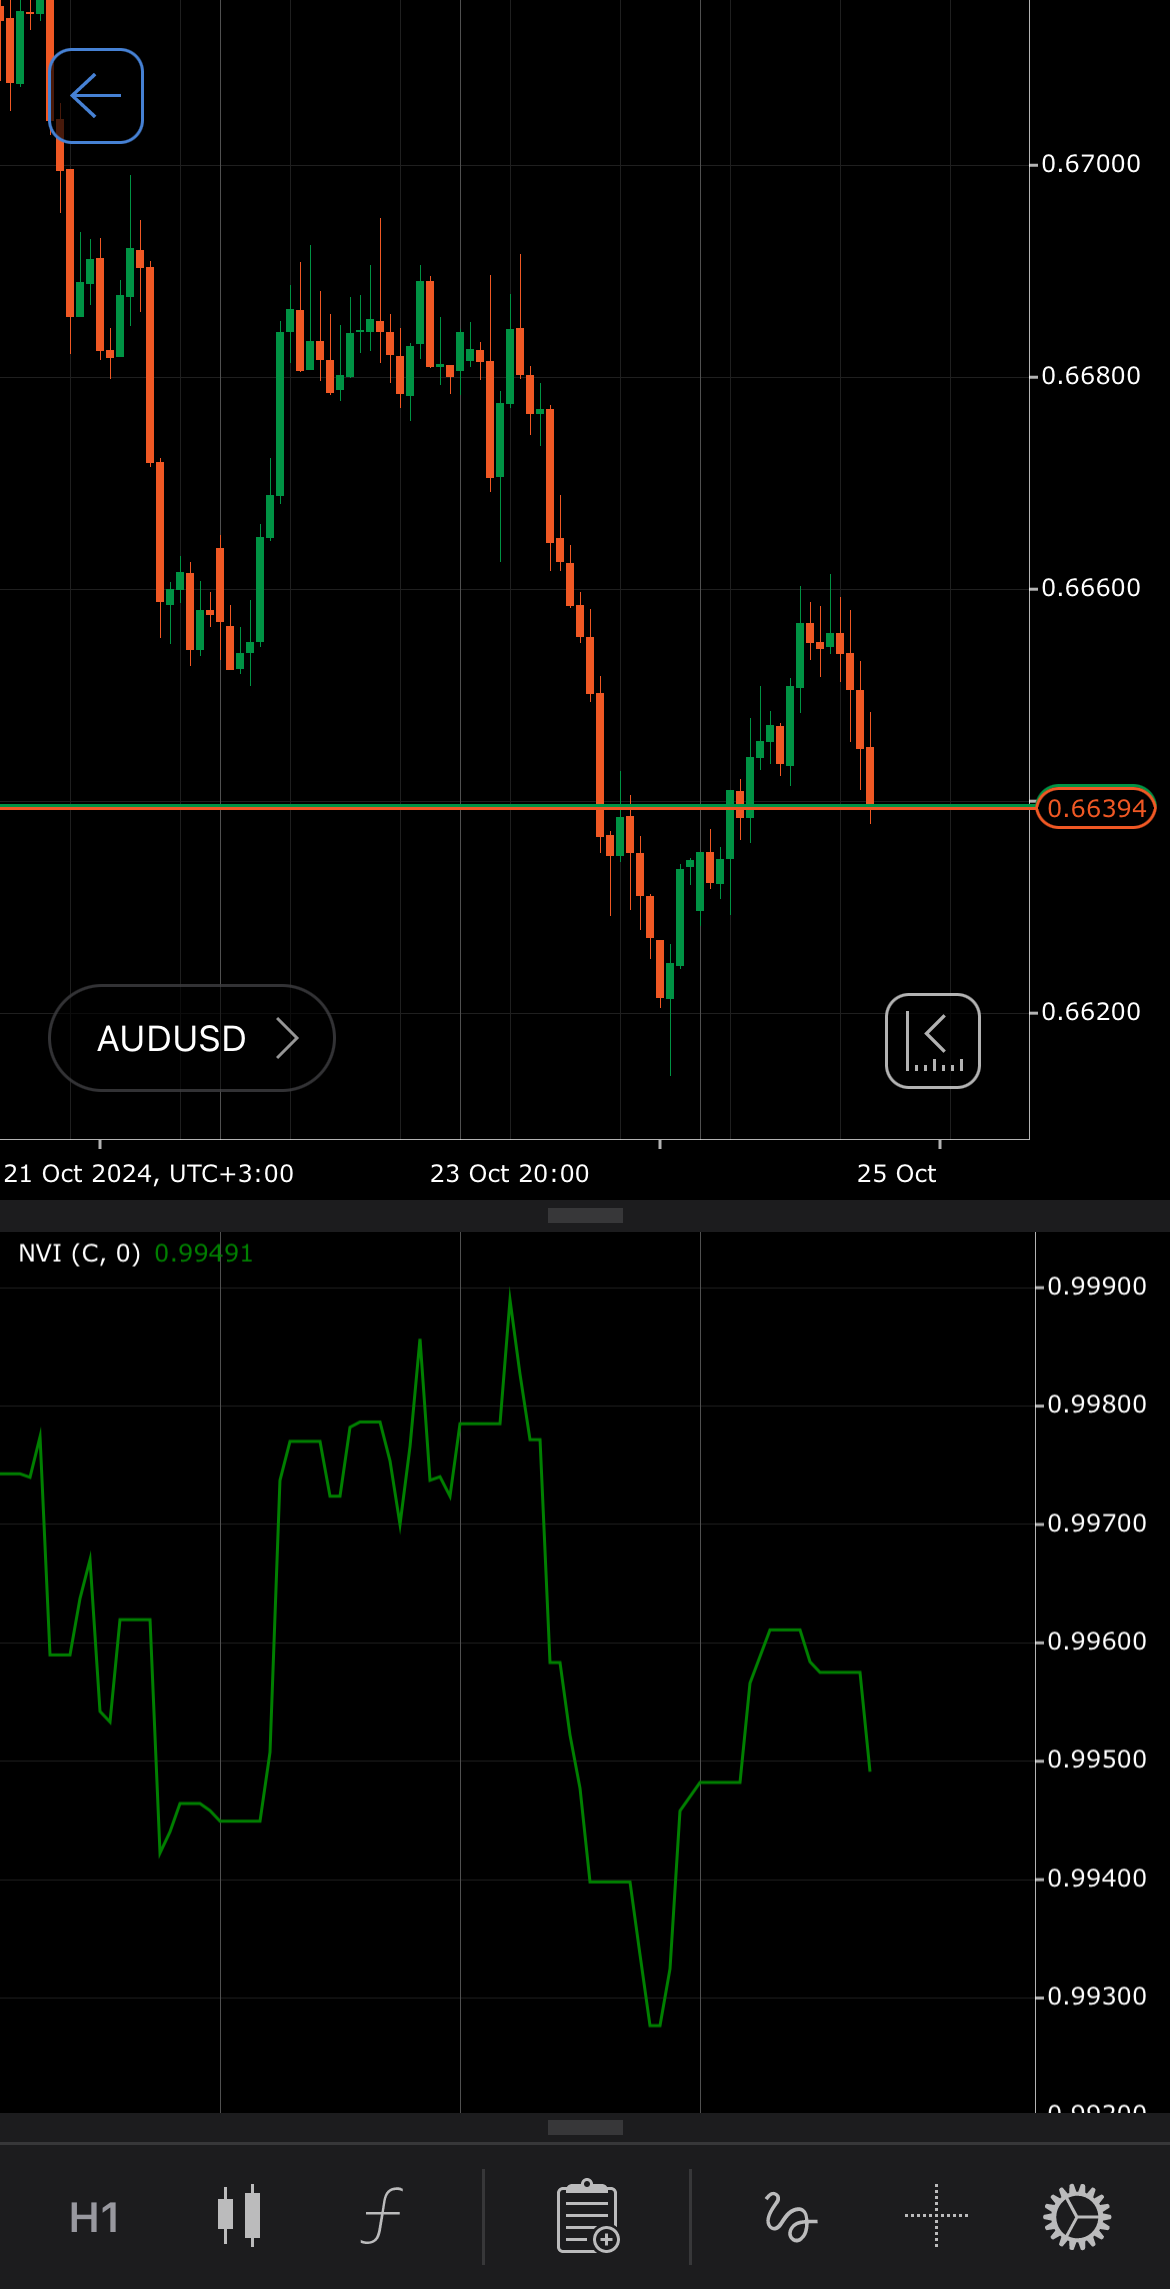
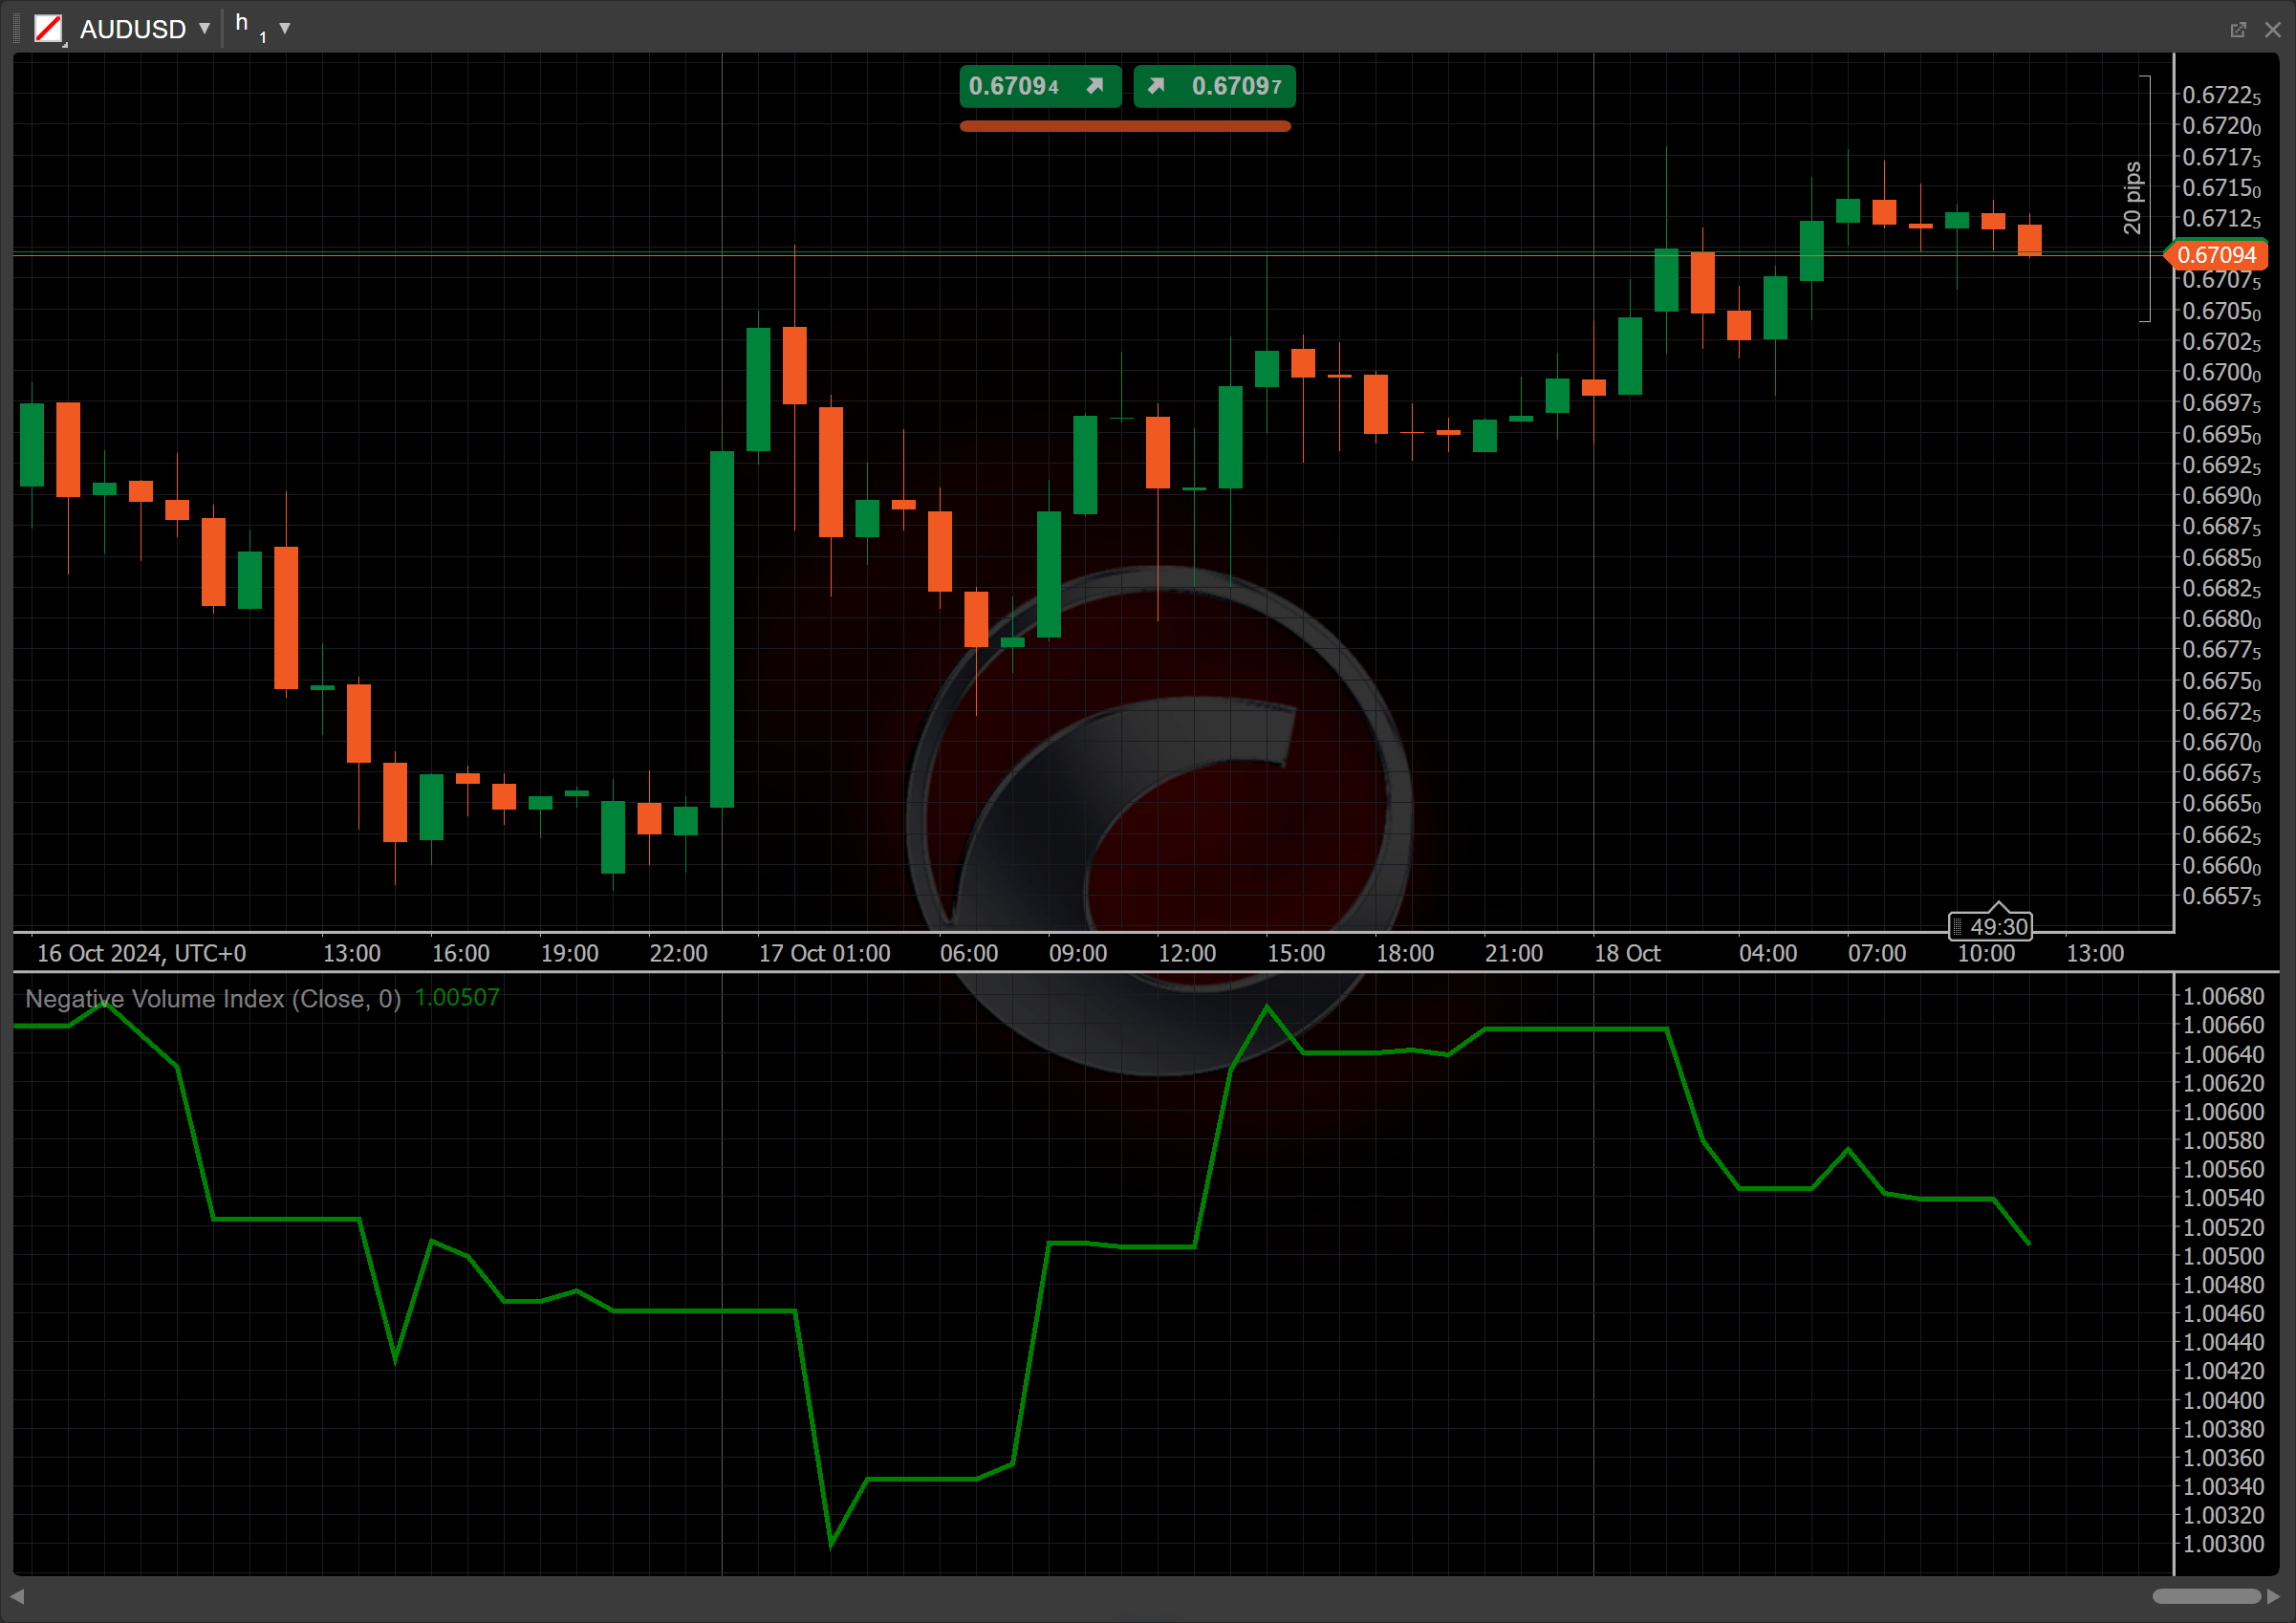
In our particular case, the default initial value of the NVI indicator is set to 1.
The main patterns of the indicator behaviour can be interpreted as follows:
-
Baseline crossovers – when the NVI is above baseline, it suggests that the price is performing well during periods of declining volume, which may indicate a positive trend. A higher NVI generally points to bullish market sentiment and long-term strength. When the NVI is below baseline, it can indicate weakness in the market. Price performance during periods of declining volume is poor, which may suggest bearish sentiment.
-
Crossovers – when the NVI crosses above a moving average, such as a 255-day Simple Moving Average (SMA), it signals strength in the market and could indicate the start of a bullish trend. A crossover below the SMA suggests weakness and potential for a bearish trend.
-
Divergence – if prices are falling while the NVI is rising, this could indicate hidden strength in the market, and a potential upward reversal might follow. If prices are rising while the NVI is falling, it suggests underlying weakness, and the trend might reverse downwards.
-
Reversal points – significant moves in the NVI, especially when paired with other indicators or volume surges, may indicate that the current trend (either bullish or bearish) is about to reverse.
-
Shift – by adjusting the shift parameter to alter the alignment of the NVI indicator with price data on the chart, you can explore how the NVI readings correspond to past or future price movements.
Application
-
Buy signal – traders can look for buying opportunities when the NVI crosses above a moving average, indicating bullish momentum during low-volume periods. A bullish divergence between a rising NVI and a falling price can also signal a buy.
-
Sell signal – traders can look for selling opportunities when the NVI crosses below a moving average or during a bearish divergence between a falling NVI and a rising price, suggesting weakness.
-
Stop-loss placement – a stop loss for buy positions can be set just below key support levels, recent lows or where the NVI crosses above the moving average. For sell positions, a stop loss is placed above resistance levels or just above where the NVI crosses below the moving average.
-
Exit strategies – for long positions, consider exiting when the NVI starts to flatten or fall after a period of rising, particularly if it drops below a moving average or if there is a bearish divergence. For short positions, an exit might be appropriate when the NVI begins to rise or crosses back above a moving average, signalling a potential reversal of the bearish trend.
-
Confirming trades – consider combining the NVI with the PVI to strengthen trade signals during complementary moves. Using moving averages (SMA or EMA) can also confirm signals, especially when both the NVI and the price are above or below the moving average.
Note
You can take advantage of algo trading, with cBots executing trades based on the signals from this indicator, as shown in our examples. Learn more about how to use indicators in cBots.
Limitations
The reliance on volume data means the indicator may not always reflect true market sentiment, leading to potential misinterpretations. Additionally, the NVI can lag in signalling trends, providing delayed responses to market movements. It may also generate false signals during low-volume periods, limiting its effectiveness in volatile or rapidly changing markets.
Summary
The Negative Volume Index indicator tracks price changes on low-volume days, based on the idea that informed traders act during these periods. If the volume decreases, the NVI is adjusted using the percentage change in price; if the volume increases, it remains unchanged. The NVI helps identify long-term trends, with a rising NVI suggesting bullish conditions. It is often used alongside other indicators, such as the PVI, to confirm trends or reversals in markets.