On Balance Volume
Definition
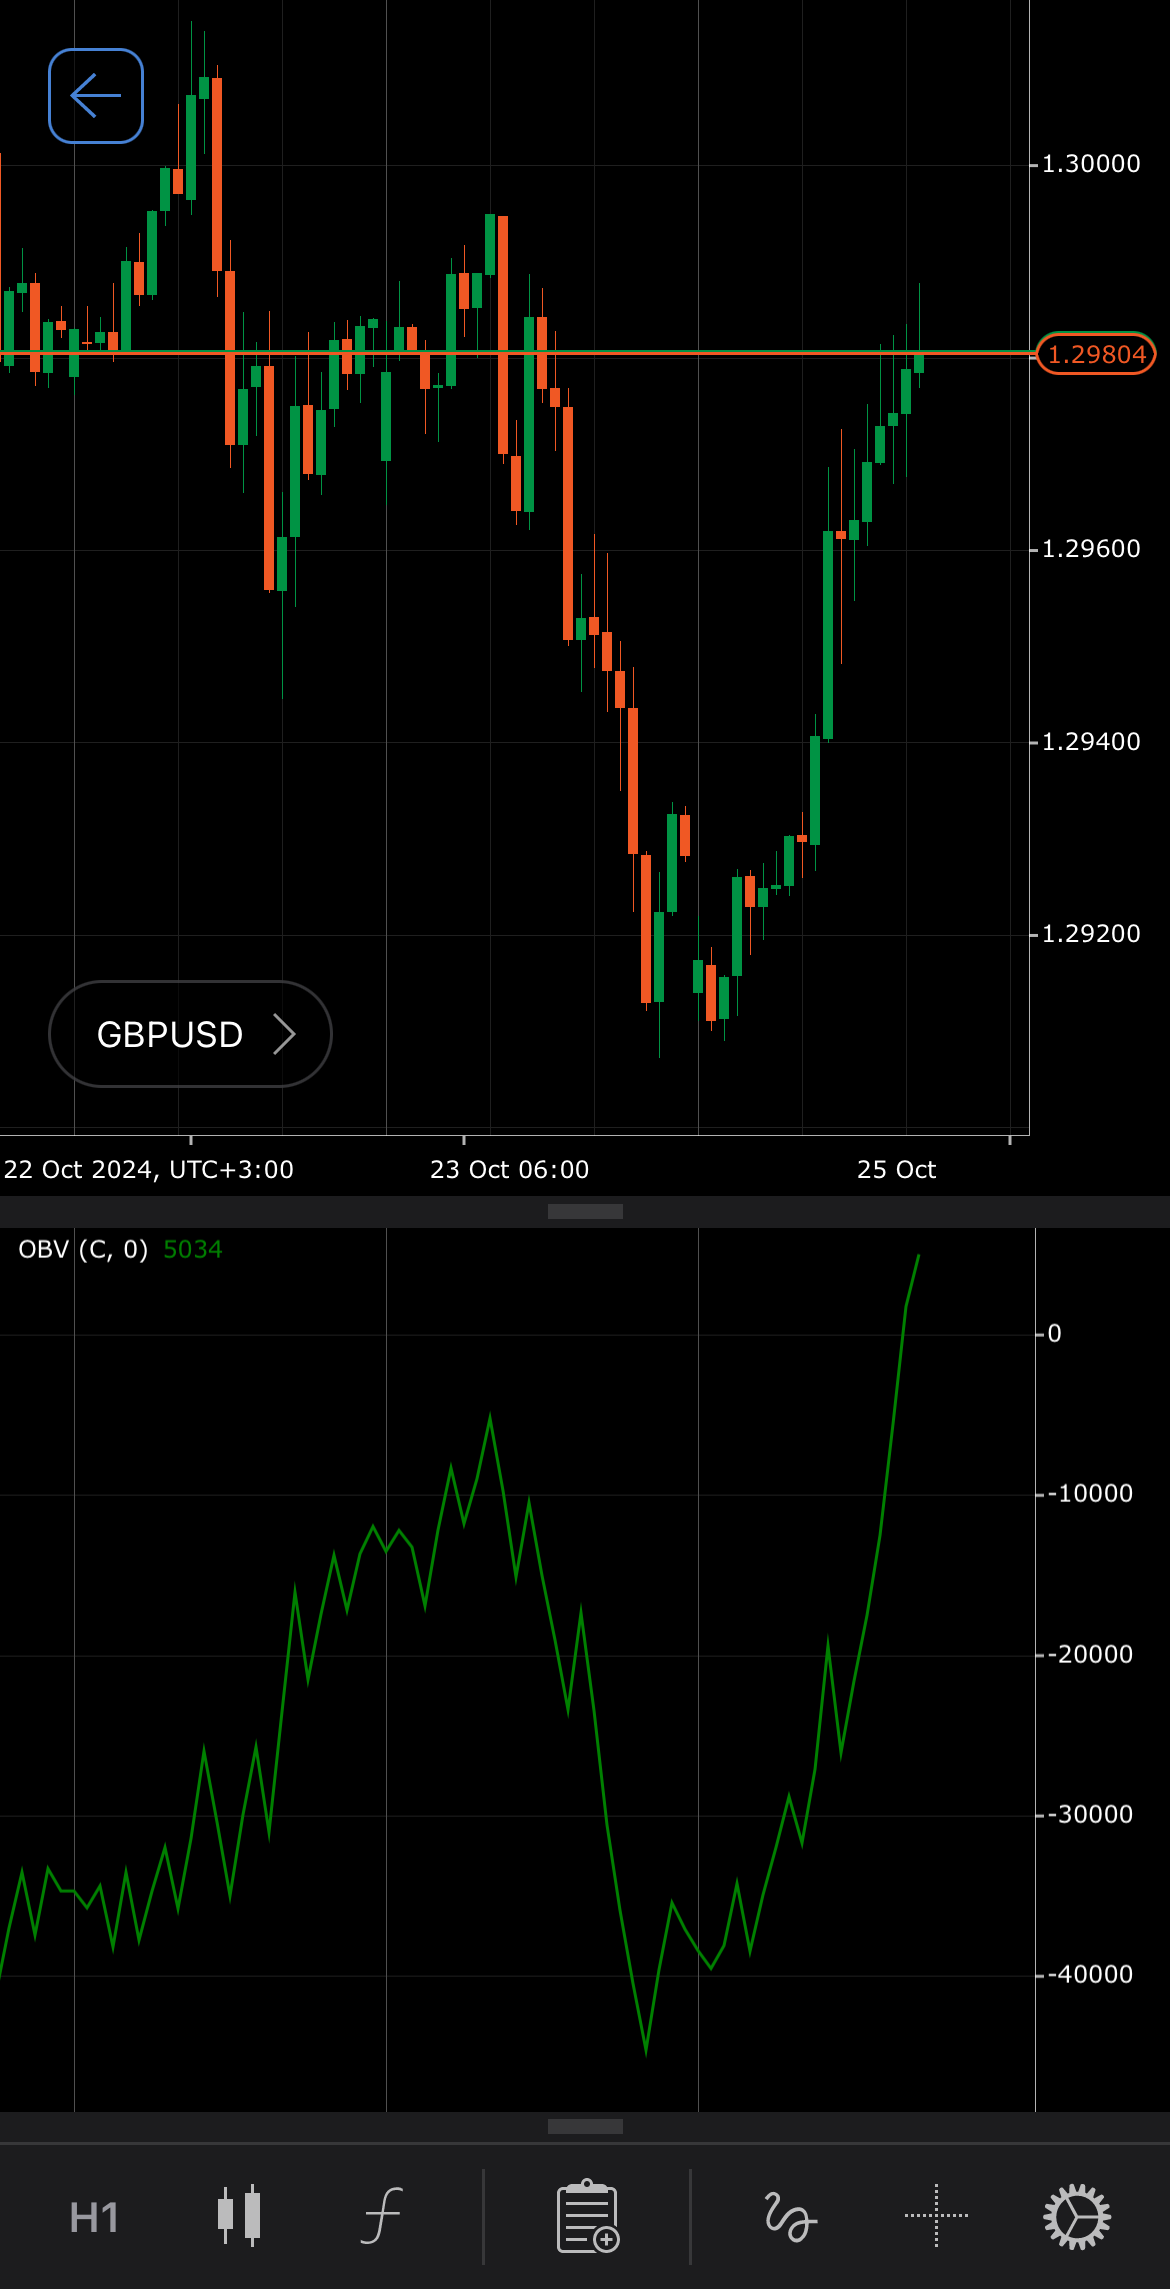
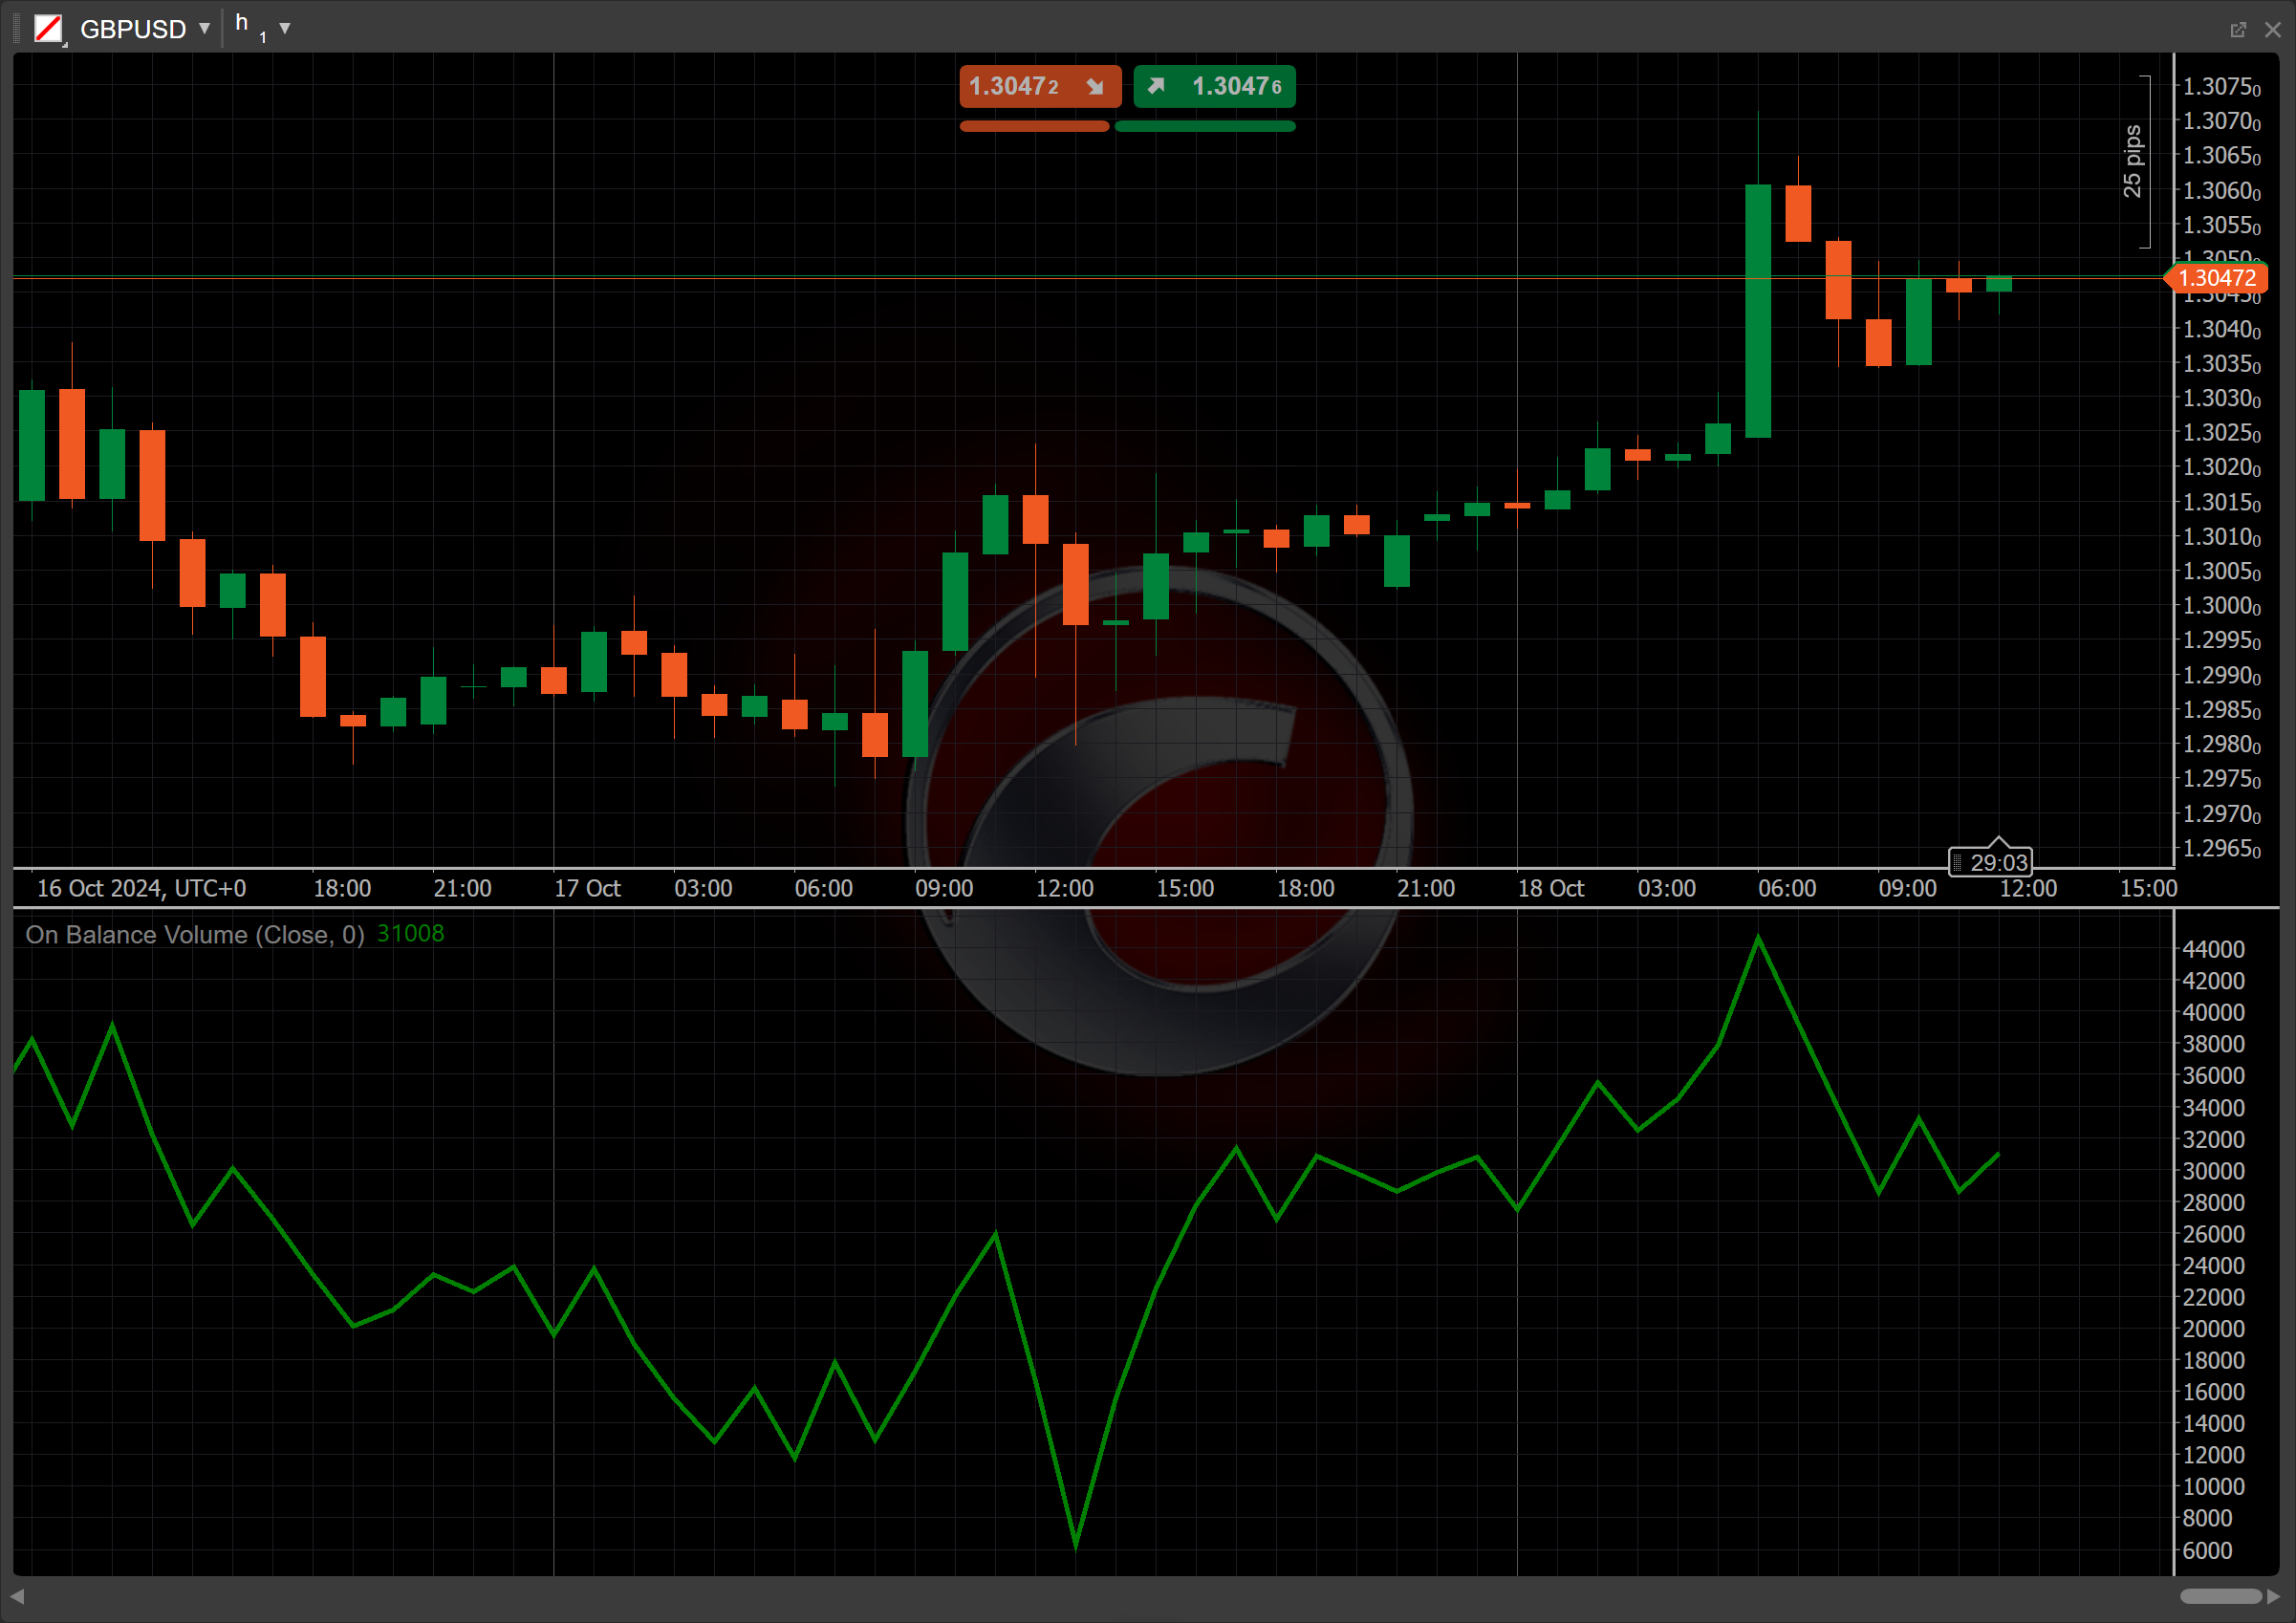
The On Balance Volume (OBV) is a technical analysis indicator that uses the volume flow to predict symbol price movements. It operates on the principle that volume precedes price changes; an increasing OBV suggests strong buying pressure, while a decreasing OBV indicates selling pressure. By analysing the OBV line alongside price trends, traders can confirm potential reversals or continuations in the market, enhancing their trading strategies.
History
The OBV indicator was described by Joseph Granville in his 1963 book, "Granville's New Key to Stock Market Profits". Granville asserted that volume is a crucial factor and a dependable indicator of stock price movements. He introduced the concept of On Balance Volume as a means to relate volume to price movements. In his book, he described the predictions generated by the OBV as “a spring being wound tightly”.
Calculations
The calculation of the OBV indicator is based on the current closing price of the symbol compared to the closing price of the previous period:
-
If \(Close \gt Close_{prev}\) then \(OBV\) = \(OBV_{prev}\) + \(TickVolume\)
-
If \(Close = Close_{prev}\) then \(OBV\) = \(OBV_{prev}\)
-
If \(Close \lt Close_{prev}\) then \(OBV\) = \(OBV_{prev}\) - \(TickVolume\)
\(OBV\) – the current on-balance volume level
\(OBV_{prev}\) – the previous on-balance volume level
\(Close\) – the current closing price
\(Close_{prev}\) – the previous closing price
\(TickVolume\) – the current tick volume
Interpretation
The initial value of the OBV is typically set at zero, serving as the baseline for subsequent calculations. The following interpretations of the indicator are generally applicable:
-
Rising and falling – an increasing OBV reflects strong buying interest and positive volume pressure that imply that prices are likely to rise. Conversely, a declining OBV reflects negative volume pressure that can foreshadow lower prices.
-
Divergence – prices are likely to rise when the OBV is increasing while prices are flat or declining, indicating a potential bullish trend. Conversely, prices are likely to fall if the OBV is decreasing while prices are flat or rising, suggesting a potential bearish trend.
Application
-
Buy signal – a potential buying opportunity occurs when the OBV rises while the price is flat or in a downtrend, indicating building buying pressure. Traders may enter a long position when the price breaks above a recent resistance level, confirming the bullish sentiment from rising OBV.
-
Sell signal – a potential selling opportunity arises when the OBV declines while the price is flat or trending upward, signalling increasing selling pressure. Traders might consider short positions when the price breaks below a support level, validating the bearish outlook suggested by falling OBV.
-
Stop-loss placement – for long positions, a stop loss can be set below recent swing lows or support levels to exit if the price falls and the OBV declines. For shorts, a stop loss can be placed above swing highs or resistance levels to limit losses if the OBV starts to rise.
-
Exit strategies – for long positions, if the OBV falls while prices rise, it may indicate a weakening trend, suggesting an exit. For short positions, rising OBV after a price drop may indicate a good exit point, as increased buying interest could lead to price rises.
-
Confirming trades – as with all indicators, it is important to use the OBV in conjunction with other aspects of technical analysis. The OBV can be combined with basic pattern analysis or to confirm signals from momentum oscillators. Also, the Simple Moving Average (SMA) of the OBV line can help filter false signals and provide further confirmation of trends.
Note
You can take advantage of algo trading, with cBots executing trades based on the signals from this indicator, as shown in our examples. Learn more about how to use indicators in cBots.
Limitations
The OBV indicator has limitations as a leading indicator, providing predictions without insights into past price movements, leading to potential false signals. To improve accuracy, it can be combined with lagging indicators, such as moving averages, to confirm breakouts. Furthermore, significant volume spikes due to events like earnings surprises or index changes can skew the OBV, reducing its reliability for identifying trends.
Summary
The On Balance Volume is a technical analysis indicator that correlates volume with price movement to forecast trends. Based on the premise that volume precedes price changes, a rising OBV indicates buying pressure, while a falling OBV suggests selling pressure. Traders use the OBV for discovering buy and sell signals to enhance decision-making in various market conditions and to identify potential price reversals and the strength of trends.