Positive Volume Index
Definition
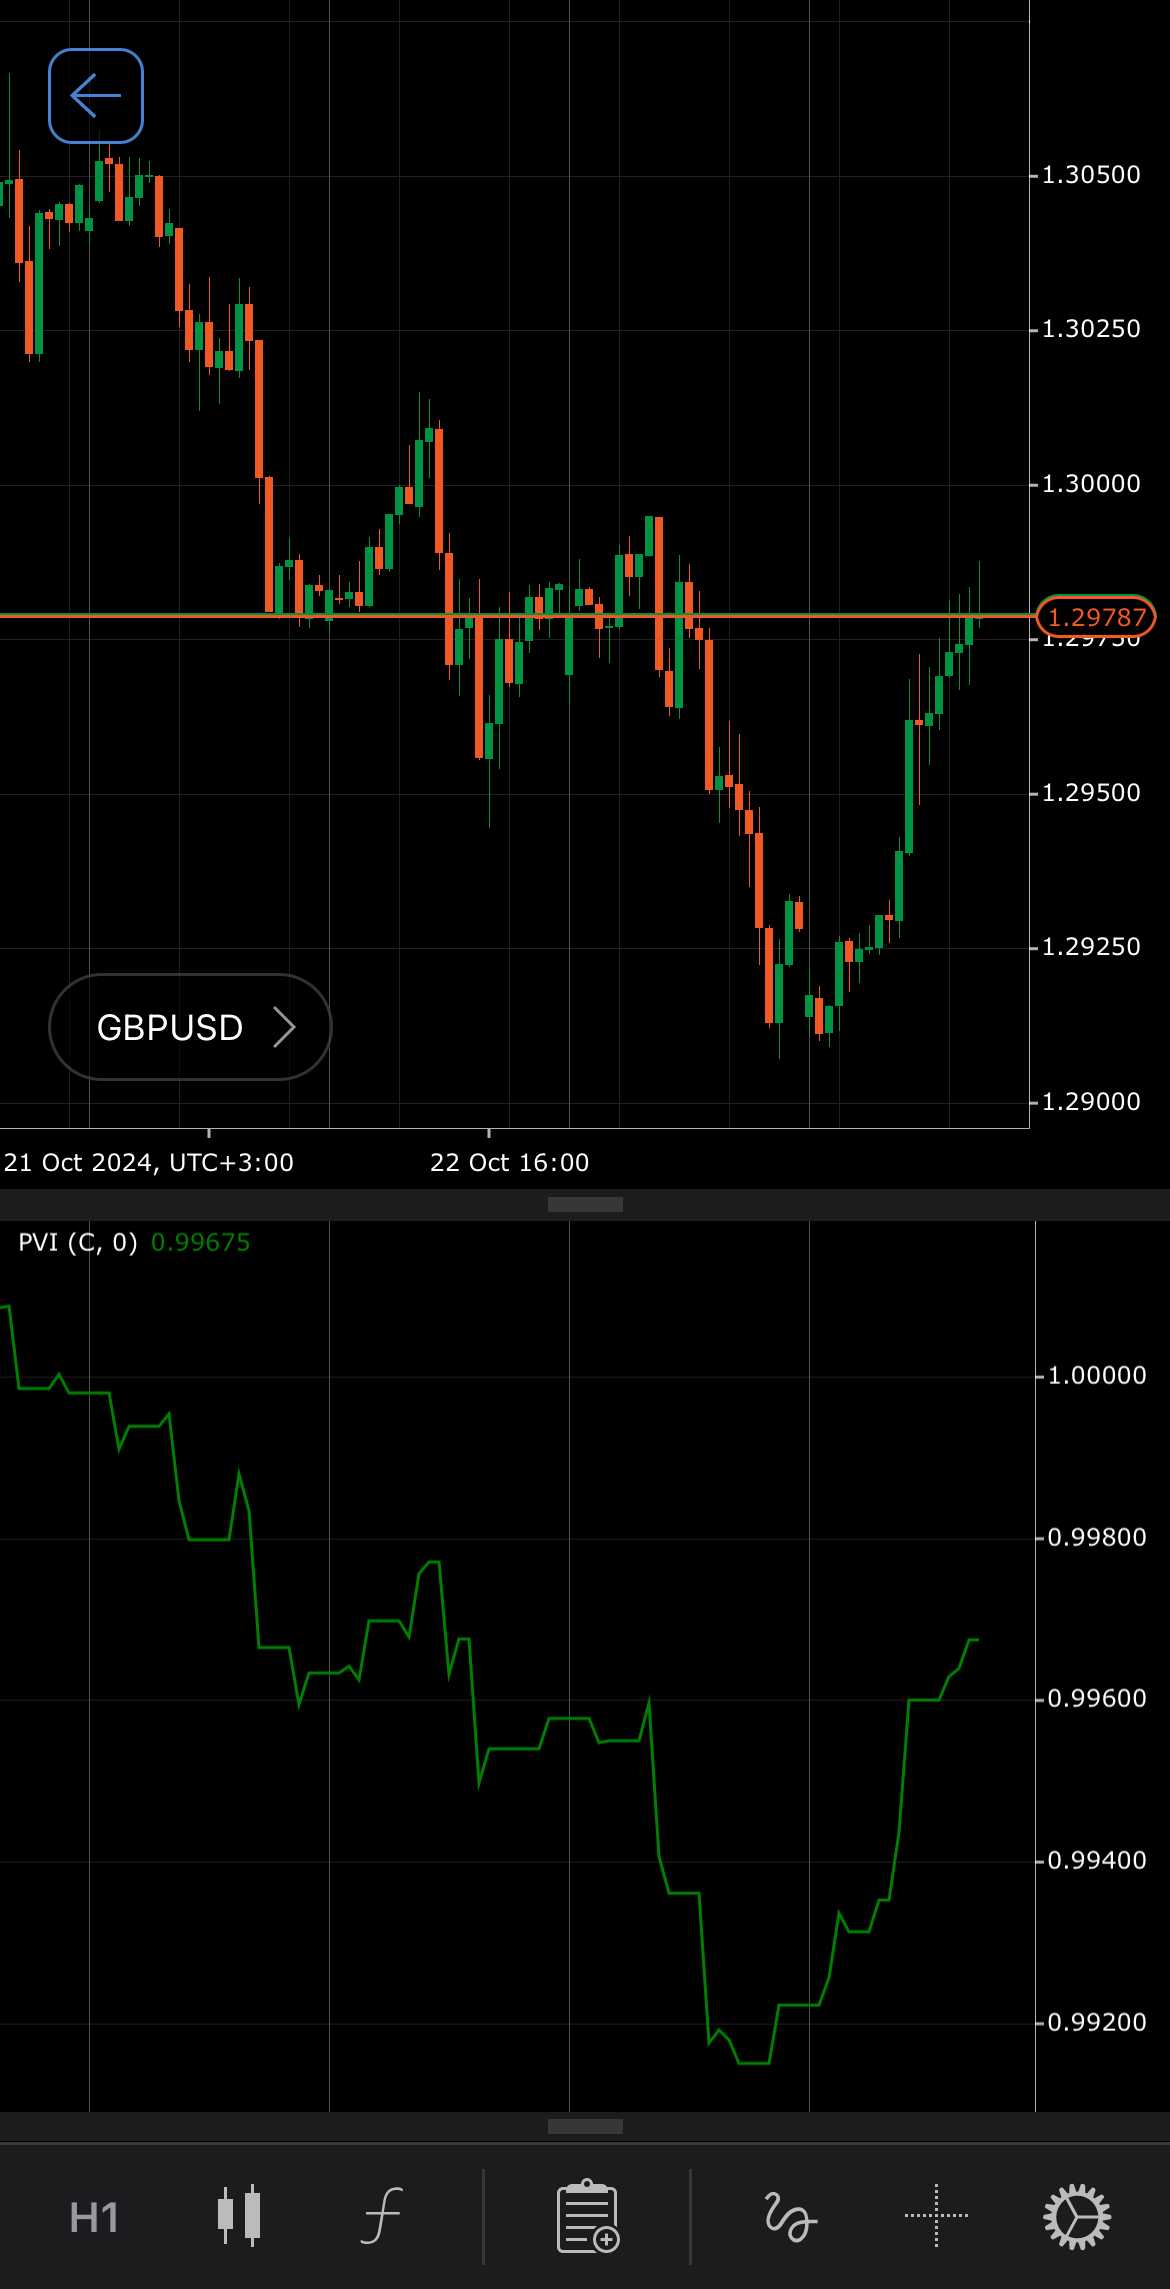
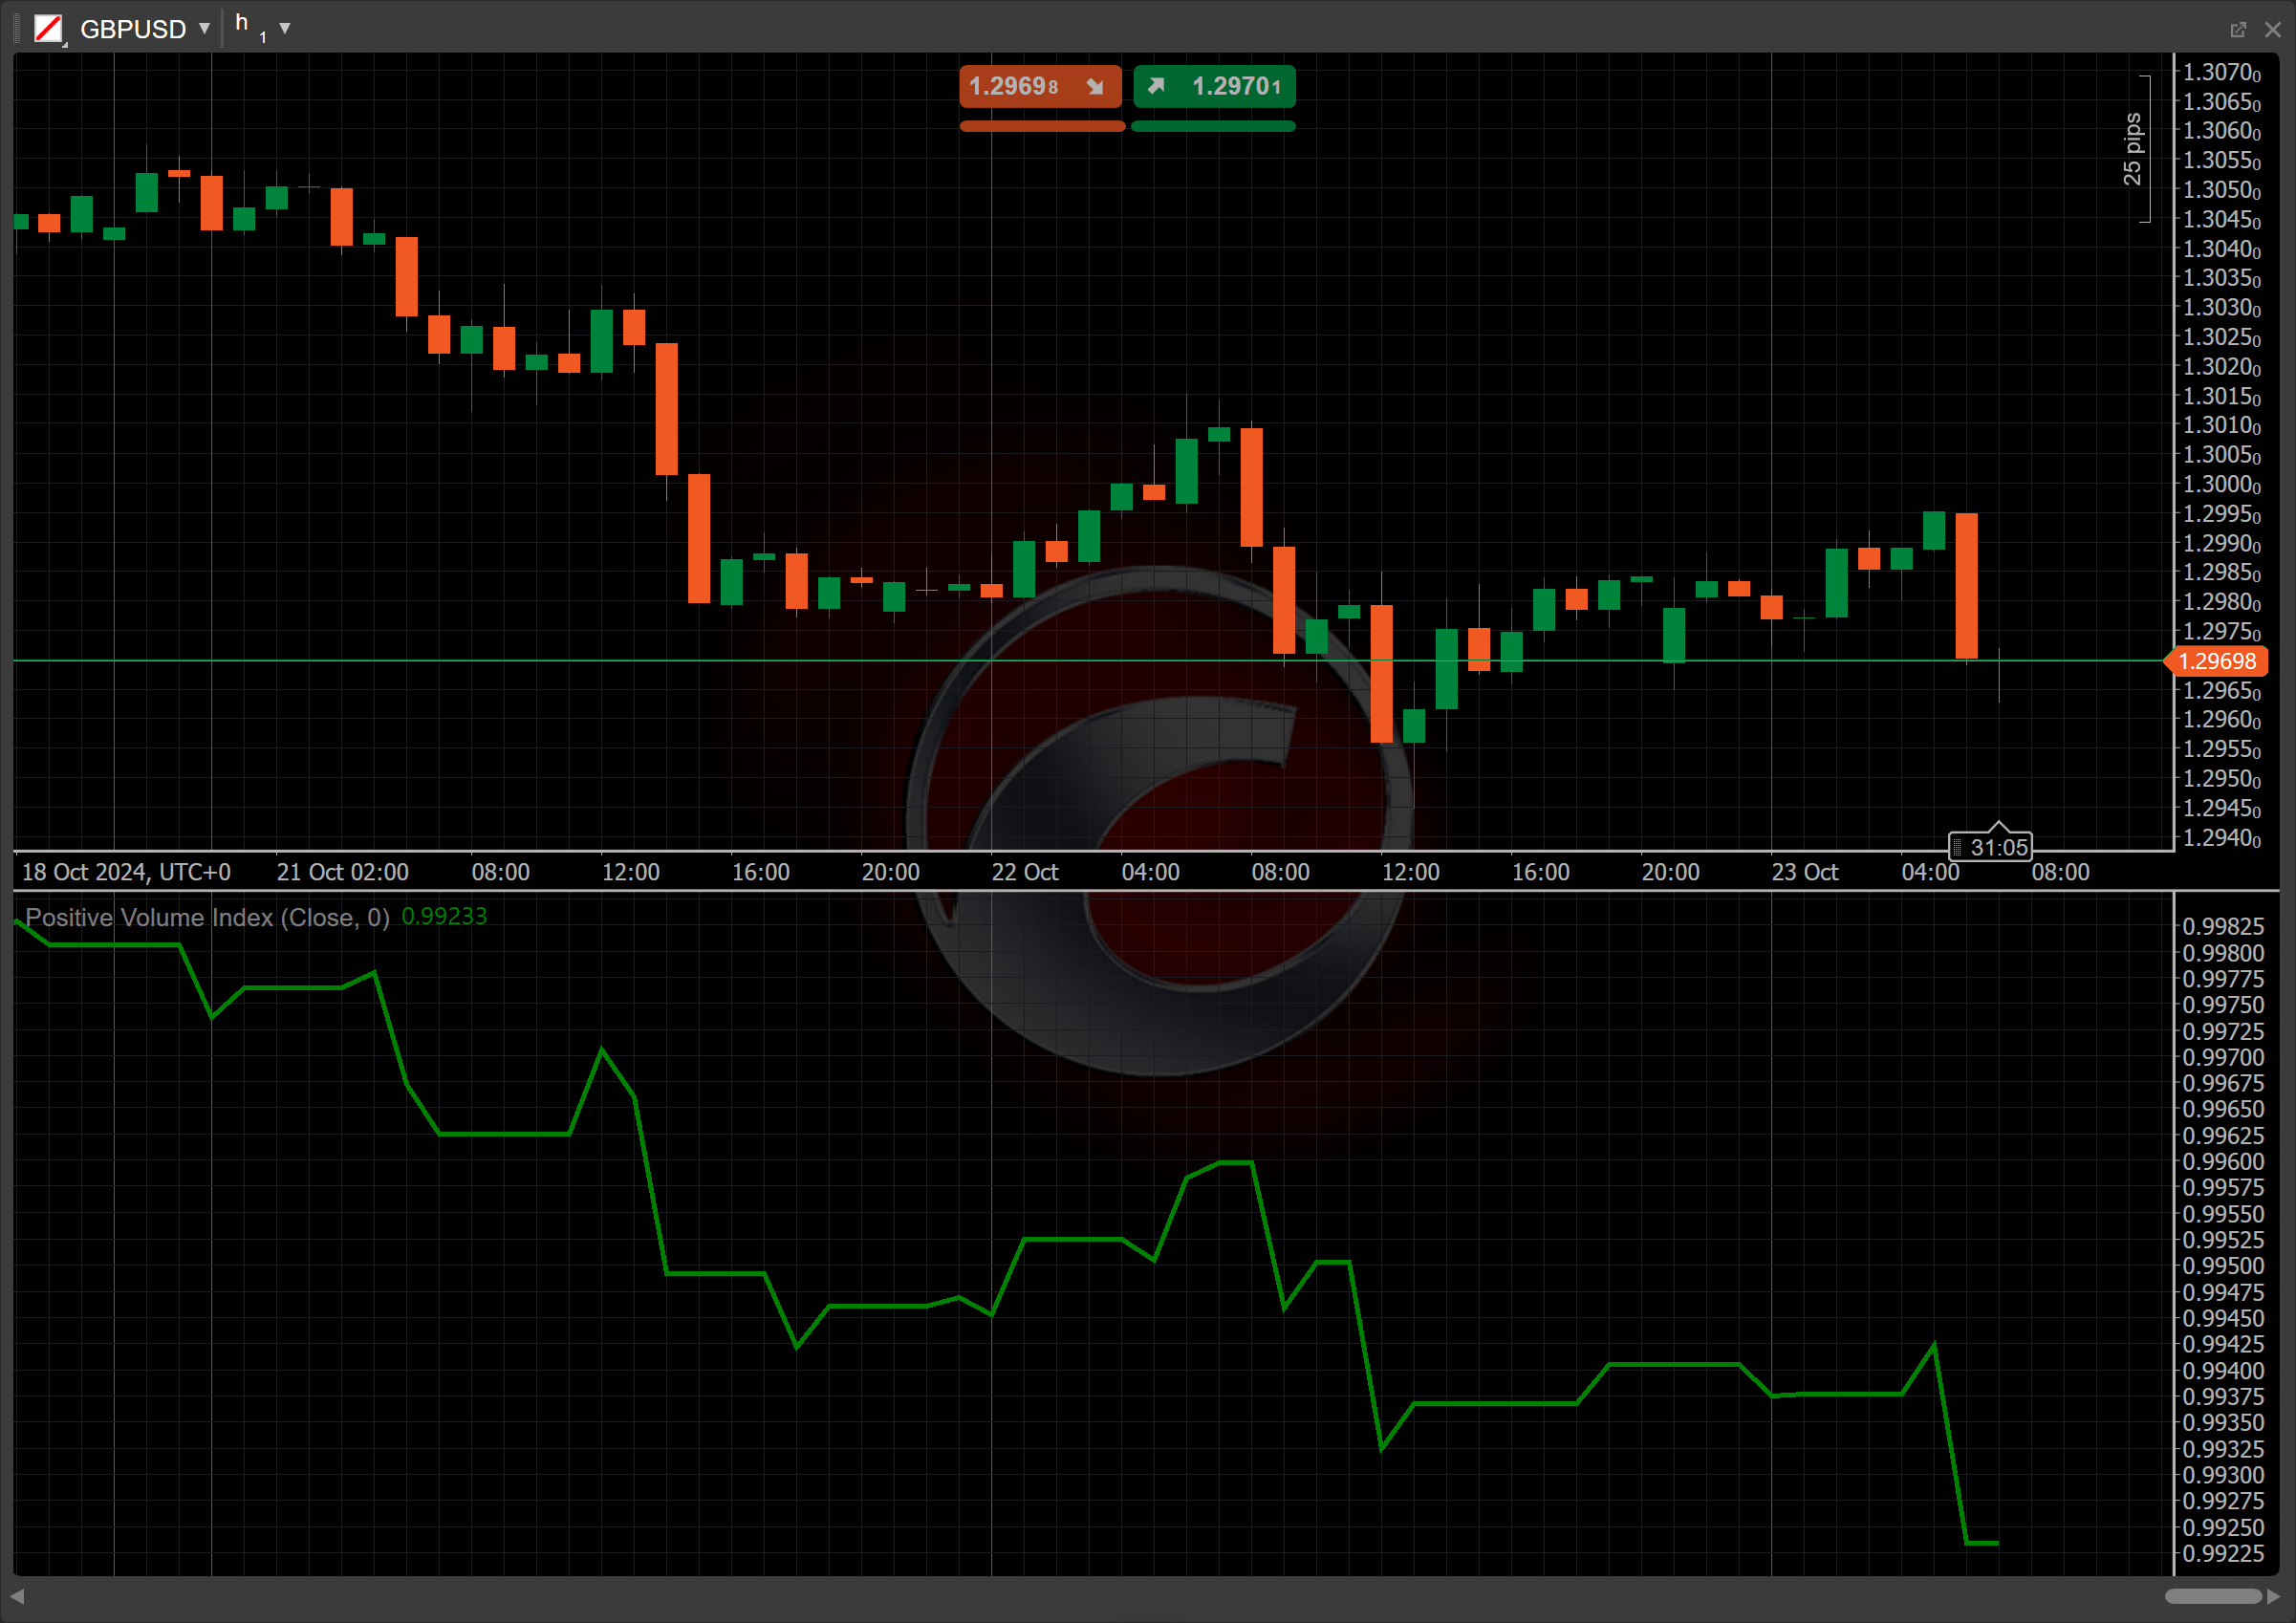
The Positive Volume Index (PVI) is a technical analysis indicator that tracks price movements based on periods of increasing trading volume. It is often paired with the Negative Volume Index (NVI) to assess market conditions. The PVI focuses on days when trading volume rises, under the assumption that uninformed or reactive traders are more active during high-volume periods. The PVI helps identify price trends in bullish markets and can signal shifts in market momentum when combined with other indicators.
History
The PVI indicator was developed alongside the NVI indicator by Paul L. Dysart in the 1930s, focusing on price movements during periods of increasing trading volume. While Dysart emphasised informed trading on low-volume days with the NVI, the PVI was created to capture price changes driven by higher-volume activity. In 1965, Norman G. Fosback expanded on Dysart’s work, popularising both indices as complementary tools in technical analysis. The PVI is now widely used to identify market trends and shifts during high-volume periods.
Calculations
To begin, the PVI baseline is set to a round number (usually 1000, 100 or 1) on the start date.
If the volume decreases in the following period, the PVI for that period will remain the same as that of the previous period. Conversely, if the volume increases during a given period, the PVI is calculated using the following formula:
\[ PVI_t = PVI_{t-1} + { { {P_t - P_{t-1} } \over P_{t-1} } \times PVI_{t-1} } \]
\(PVI_t\) – the Positive Volume Index for the current period
\(PVI_{t-1}\) – the Positive Volume Index for the previous period
\(P_t\) – the closing price for the current period
\(P_{t-1}\) – the closing price for the previous period
Interpretation
The default initial value of the PVI indicator is set to 1.
The main patterns of the indicator behaviour can be interpreted as follows:
-
Baseline crossovers – when the PVI is above the baseline, it suggests that the price is rising during high-volume periods, which indicates strong market participation and bullish sentiment. When the PVI is below the baseline, it signals weaker price performance during periods of rising volume, suggesting bearish sentiment or increased selling pressure.
-
Crossovers – when the PVI crosses above a moving average, such as a 255-day Simple Moving Average (SMA), it signals market strength and the potential start of a bullish trend. A crossover below the SMA indicates market weakness and the possibility of a bearish trend.
-
Divergence – if prices are rising while the PVI is falling, it may indicate underlying weakness in the market, signalling a potential downward reversal. Conversely, if prices are falling while the PVI is rising, it could suggest hidden strength and a possible upward reversal.
-
Reversal points – significant changes in the PVI, particularly when paired with other indicators or volume surges, may signal that the current trend (either bullish or bearish) is about to reverse.
-
Shift – by adjusting the shift parameter to alter the alignment of the PVI indicator with price data on the chart, you can explore how the PVI readings correspond to past or future price movements.
Application
-
Buy signal – consider placing a buy order when the PVI crosses above a moving average, indicating bullish momentum during high-volume periods. A bullish divergence (for example, rising PVI or falling price) can also signal a potential buy opportunity.
-
Sell signal – consider placing a sell order when the PVI crosses below a moving average or during a bearish divergence (for example, falling PVI or rising price), indicating potential weakness.
-
Stop-loss placement – for buy positions, a stop loss can be set just below key support levels, recent lows, or where the PVI crosses above the moving average. For sell positions, a stop loss is placed above resistance levels or just above the point where the PVI crosses below the moving average.
-
Exit strategies – for long positions, consider exiting when the PVI flattens or starts to fall after a period of rising, especially if it drops below a moving average or shows a bearish divergence. For short positions, an exit might be appropriate when the PVI begins to rise or crosses back above a moving average, signalling a potential bullish reversal.
-
Confirming trades – consider combining the PVI with the NVI for stronger trade signals during complementary moves. Using moving averages (SMA or EMA) can confirm signals, particularly when both the PVI and the price are above or below the moving average.
Note
You can take advantage of algo trading, with cBots executing trades based on the signals from this indicator, as shown in our examples. Learn more about how to use indicators in cBots.
Limitations
The reliance on volume data means the PVI may not consistently capture true market sentiment, leading to possible misinterpretations. Additionally, the PVI can lag in signalling trends, resulting in delayed responses to market movements. It may generate false signals during periods of high volatility, as price movements can be influenced by factors unrelated to volume, limiting its effectiveness in rapidly changing markets. Furthermore, the PVI may overlook important price actions that occur during low-volume periods, potentially missing critical market shifts.
Summary
The Positive Volume Index indicator tracks price changes on high-volume days, based on the premise that uninformed traders react during these periods. If the volume increases, the PVI is adjusted using the percentage change in price; if the volume decreases, it remains unchanged. The PVI helps identify long-term trends, with a rising PVI indicating bullish conditions. It is frequently used alongside other indicators, such as the Negative Volume Index, to confirm trends or reversals in the market.