Price Volume Trend
Definition
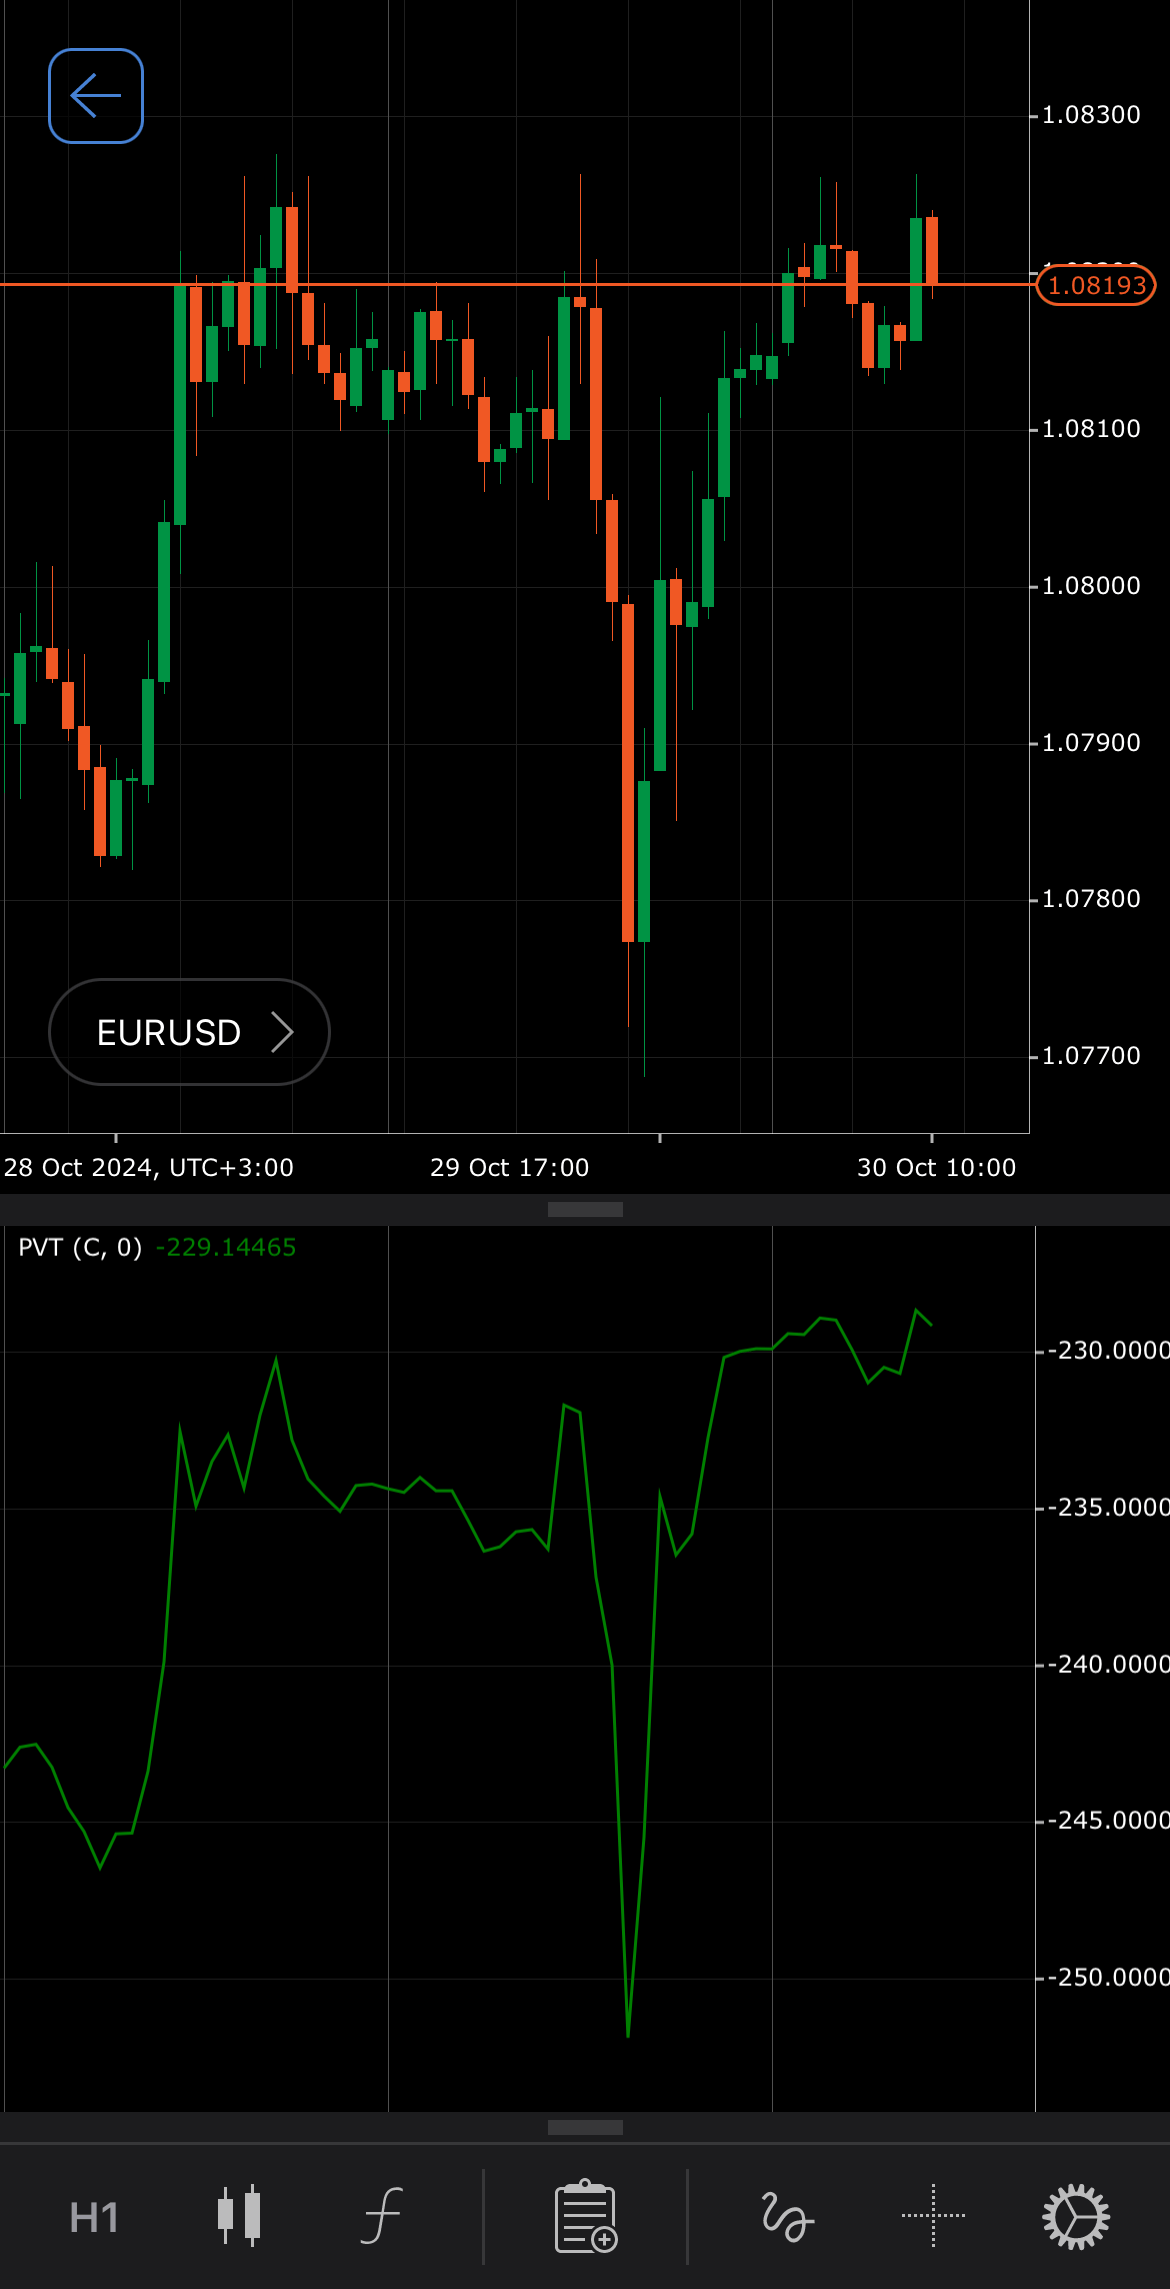
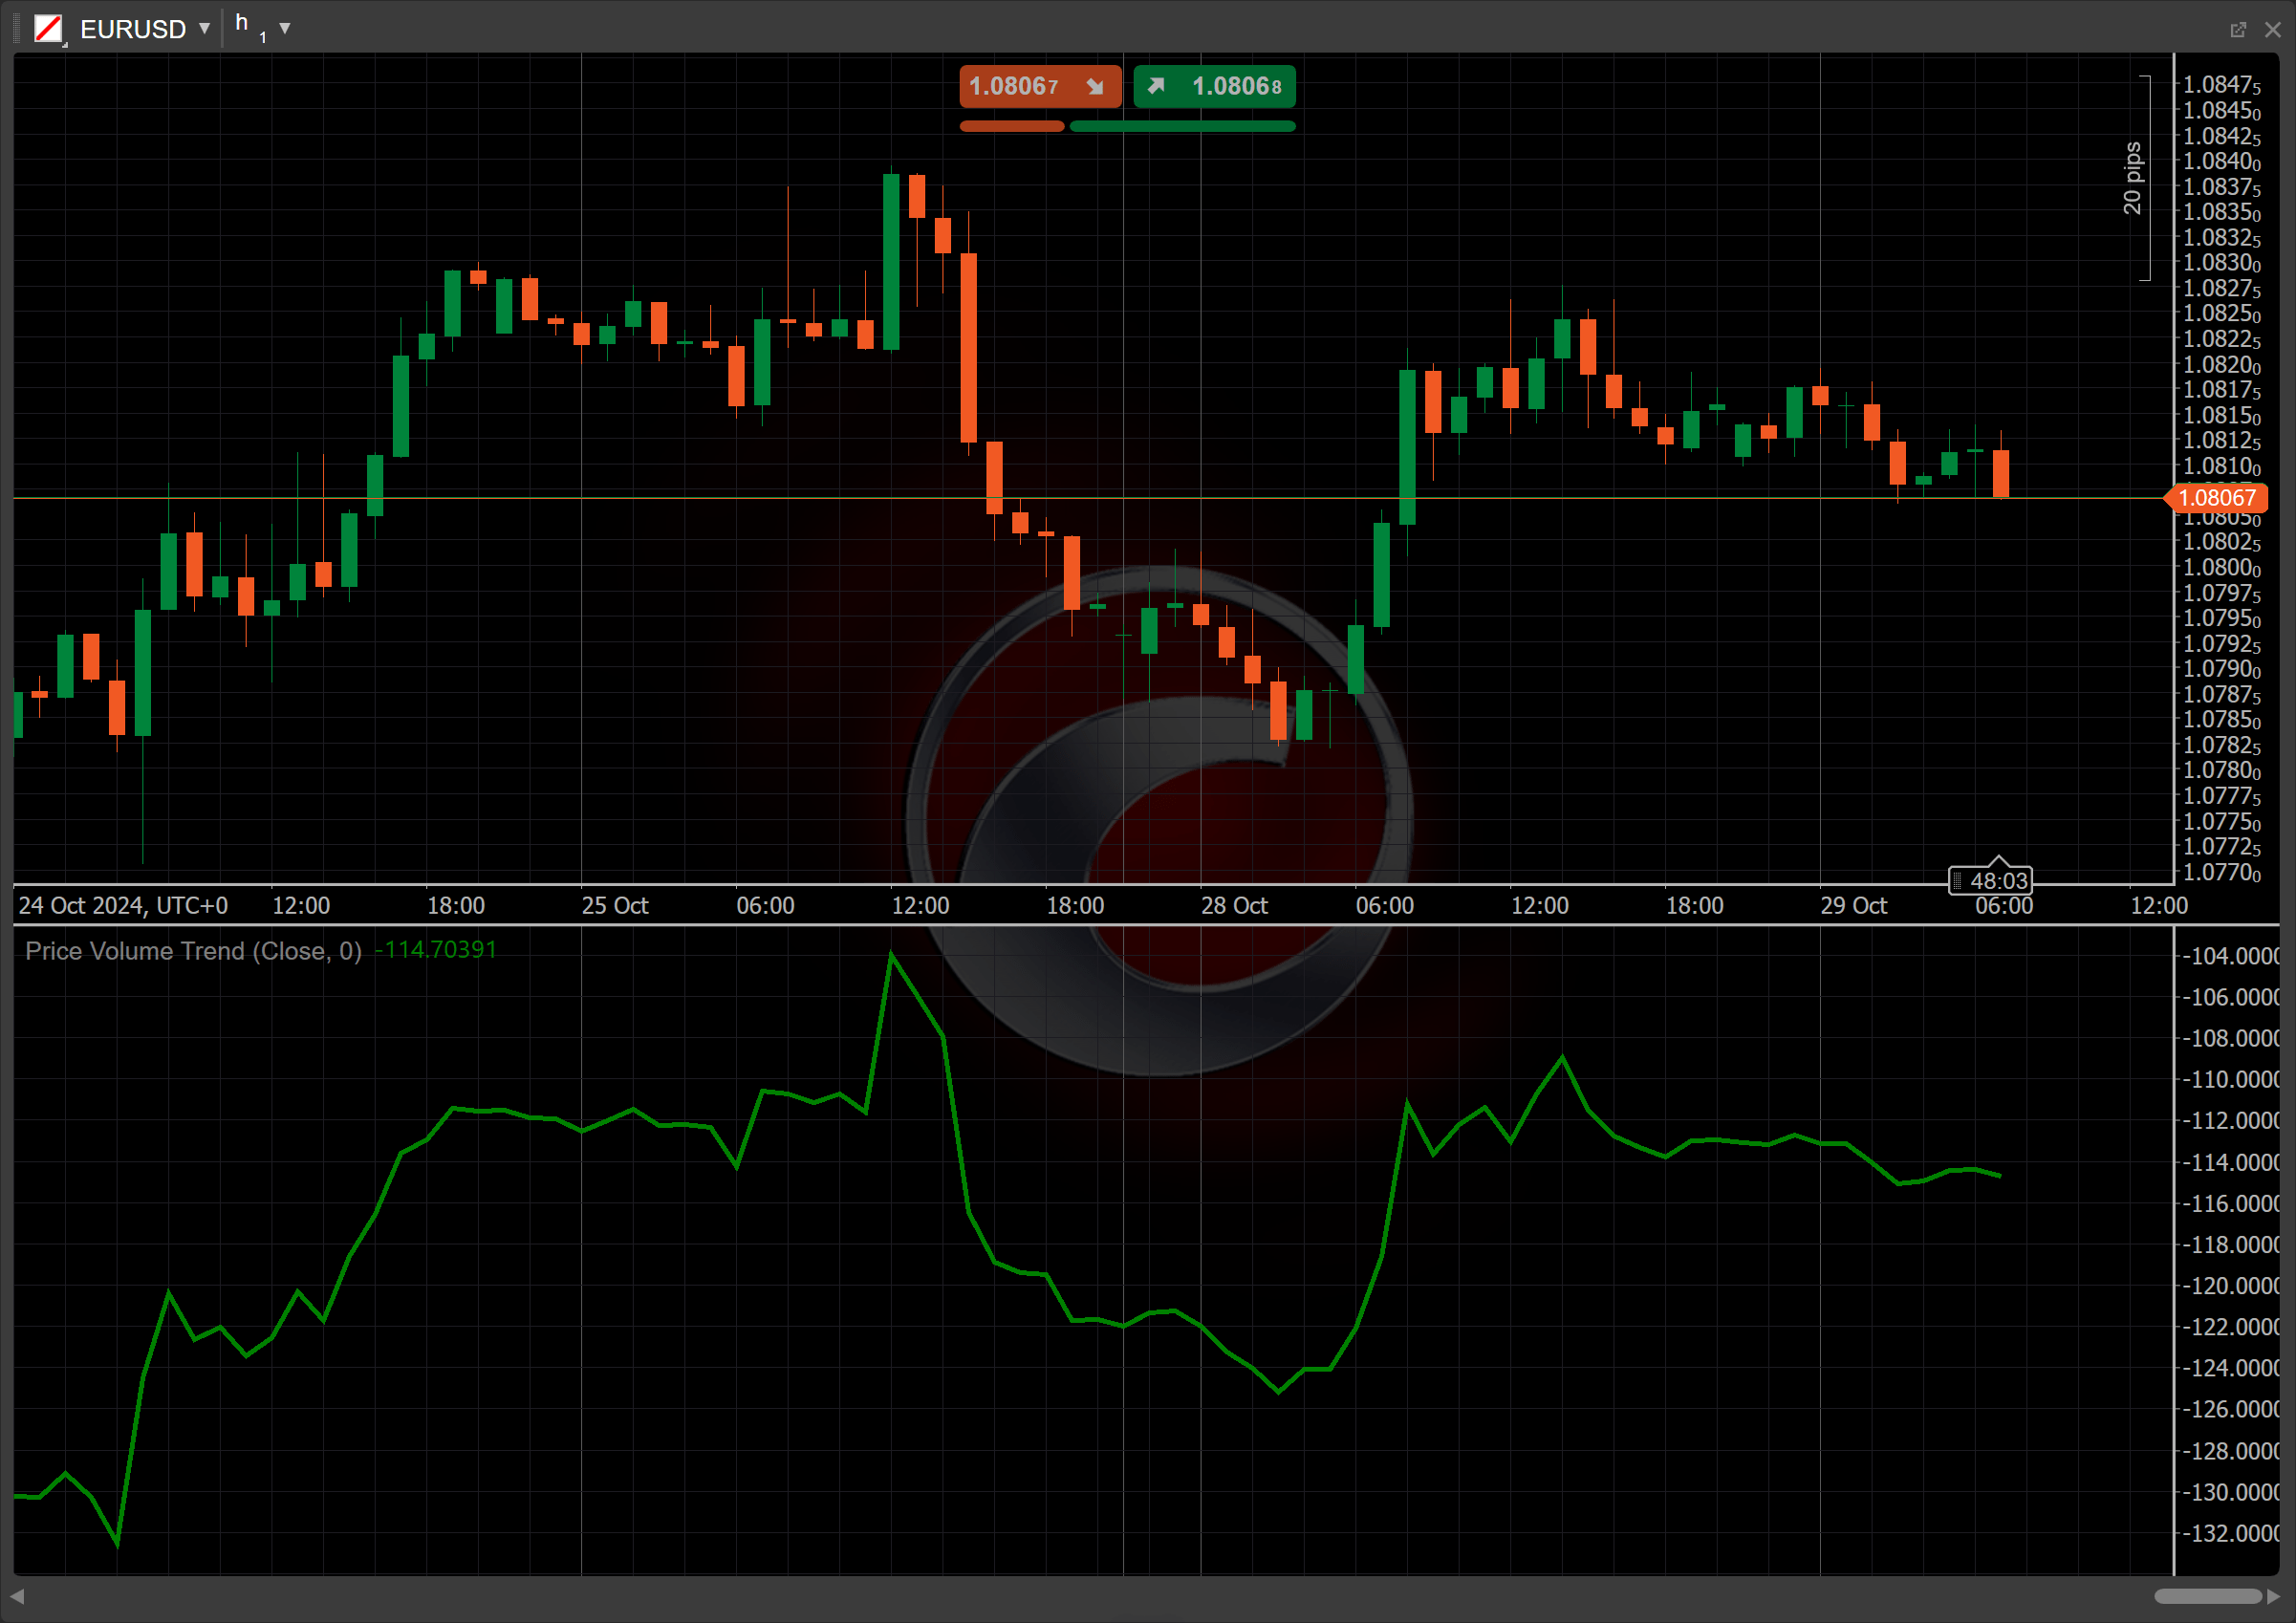
The Price Volume Trend (PVT) is a technical indicator that combines price movement and trading volume to assess the strength of a trend. It calculates a cumulative total that increases with rising prices and decreases with falling prices, weighted by the volume. The PVT provides insight into the relationship between price and volume, helping traders identify potential trend reversals and confirm ongoing trends. It is particularly useful for detecting bullish or bearish signals, making it a valuable tool in technical analysis.
History
The Price Volume Trend indicator was developed in the 1960s by the trader and author, J. Welles Wilder Jr., who is also known for creating other popular indicators like the Relative Strength Index (RSI). Similar to the On Balance Volume (OBV) indicator, which accumulates volume based on daily price changes, PVT enhances this approach by only adding or subtracting a portion of daily volume. This makes the PVT particularly useful for confirming trends and identifying potential trading signals, especially when divergences occur, providing traders with deeper insights into market dynamics.
Calculations
The PVT indicator is calculated using the following formula:
\[ PVT = PVT_{prev} + { { {Close - Close_{prev} } \over Close_{prev} } \times TickVolume } \]
\(PVT\) – the current Price Volume Trend level
\(PVT_{prev}\) – the previous Price Volume Trend level
\(Close\) – the current closing price
\(Close_{prev}\) – the previous closing price
\(TickVolume\) – the current tick volume
Interpretation
The initial value of the PVT is typically set at zero, serving as the baseline for subsequent calculations.
The following interpretations of the indicator are generally applicable:
-
Crossovers – crossovers between the PVT line and a moving average (such as the Simple Moving Average) can provide trading signals. A bullish crossover occurs when the PVT crosses above a moving average, while a bearish crossover happens when it crosses below.
-
Rising and falling – a rising PVT indicates that the price is increasing along with volume, suggesting a strong uptrend. A falling PVT implies decreasing prices and volume, which may indicate a downtrend or weakening trend.
-
Divergence – if prices are making new highs while the PVT fails to follow suit, it indicates weakening momentum and a potential reversal to the downside. Conversely, if prices make new lows while the PVT rises, it suggests a possible bullish reversal.
-
Reversal points – significant changes in PVT, particularly when paired with other indicators or volume surges, may signal that the current trend (either bullish or bearish) is about to reverse.
-
Shift – by adjusting the shift parameter to alter the alignment of the PVT indicator with price data on the chart, you can explore how the PVT readings correspond to past or future price movements.
Application
-
Buy signal – consider placing a buy order when the PVT crosses above a specified moving average, indicating increasing buying pressure. Additionally, if the PVT rises while the price makes higher lows, this further strengthens the buy signal, suggesting potential bullish momentum.
-
Sell signal – consider placing a sell order when the PVT crosses below a moving average, signalling rising selling pressure. This is especially effective if the price is making lower highs while the PVT is declining, indicating bearish momentum and potential trend continuation.
-
Stop-loss placement – a stop loss can be strategically placed below recent swing lows for buy positions or above swing highs for sell positions. This helps protect against adverse price movements and can be adjusted based on the PVT trends.
-
Exit strategies – traders can consider exit positions when the PVT shows signs of divergence from price action, indicating a potential reversal. Additionally, if the PVT crosses back below a moving average in a long position or above it in a short position, it can signal an exit point.
-
Confirming trades – a bullish crossover of the PVT above the Simple Moving Average (SMA) signals a potential buy, while a bearish crossover below indicates a sell, allowing traders to assess trend strength and dynamically adjust strategies based on market conditions.
Note
You can take advantage of algo trading, with cBots executing trades based on the signals from this indicator, as shown in our examples. Learn more about how to use indicators in cBots.
Limitations
The Price Volume Trend indicator has limitations, including lagging signals due to its reliance on past price and volume data, which may delay responses to sudden market changes. Additionally, the PVT can produce false signals in volatile or choppy markets, making it essential for traders to combine it with other indicators for improved accuracy and context in decision-making.
Summary
The Price Volume Trend indicator is a valuable tool for analysing the relationship between price movements and trading and helps traders identify trends and potential reversals. The PVT calculates its value based on the proportion of volume adjusted for price changes, providing insights into market momentum and signalling buy or sell opportunities through crossovers with moving averages. While effective for confirming trades, it is best used alongside other indicators to mitigate limitations such as lagging signals and false readings in volatile markets.