Tick Volume
Definition
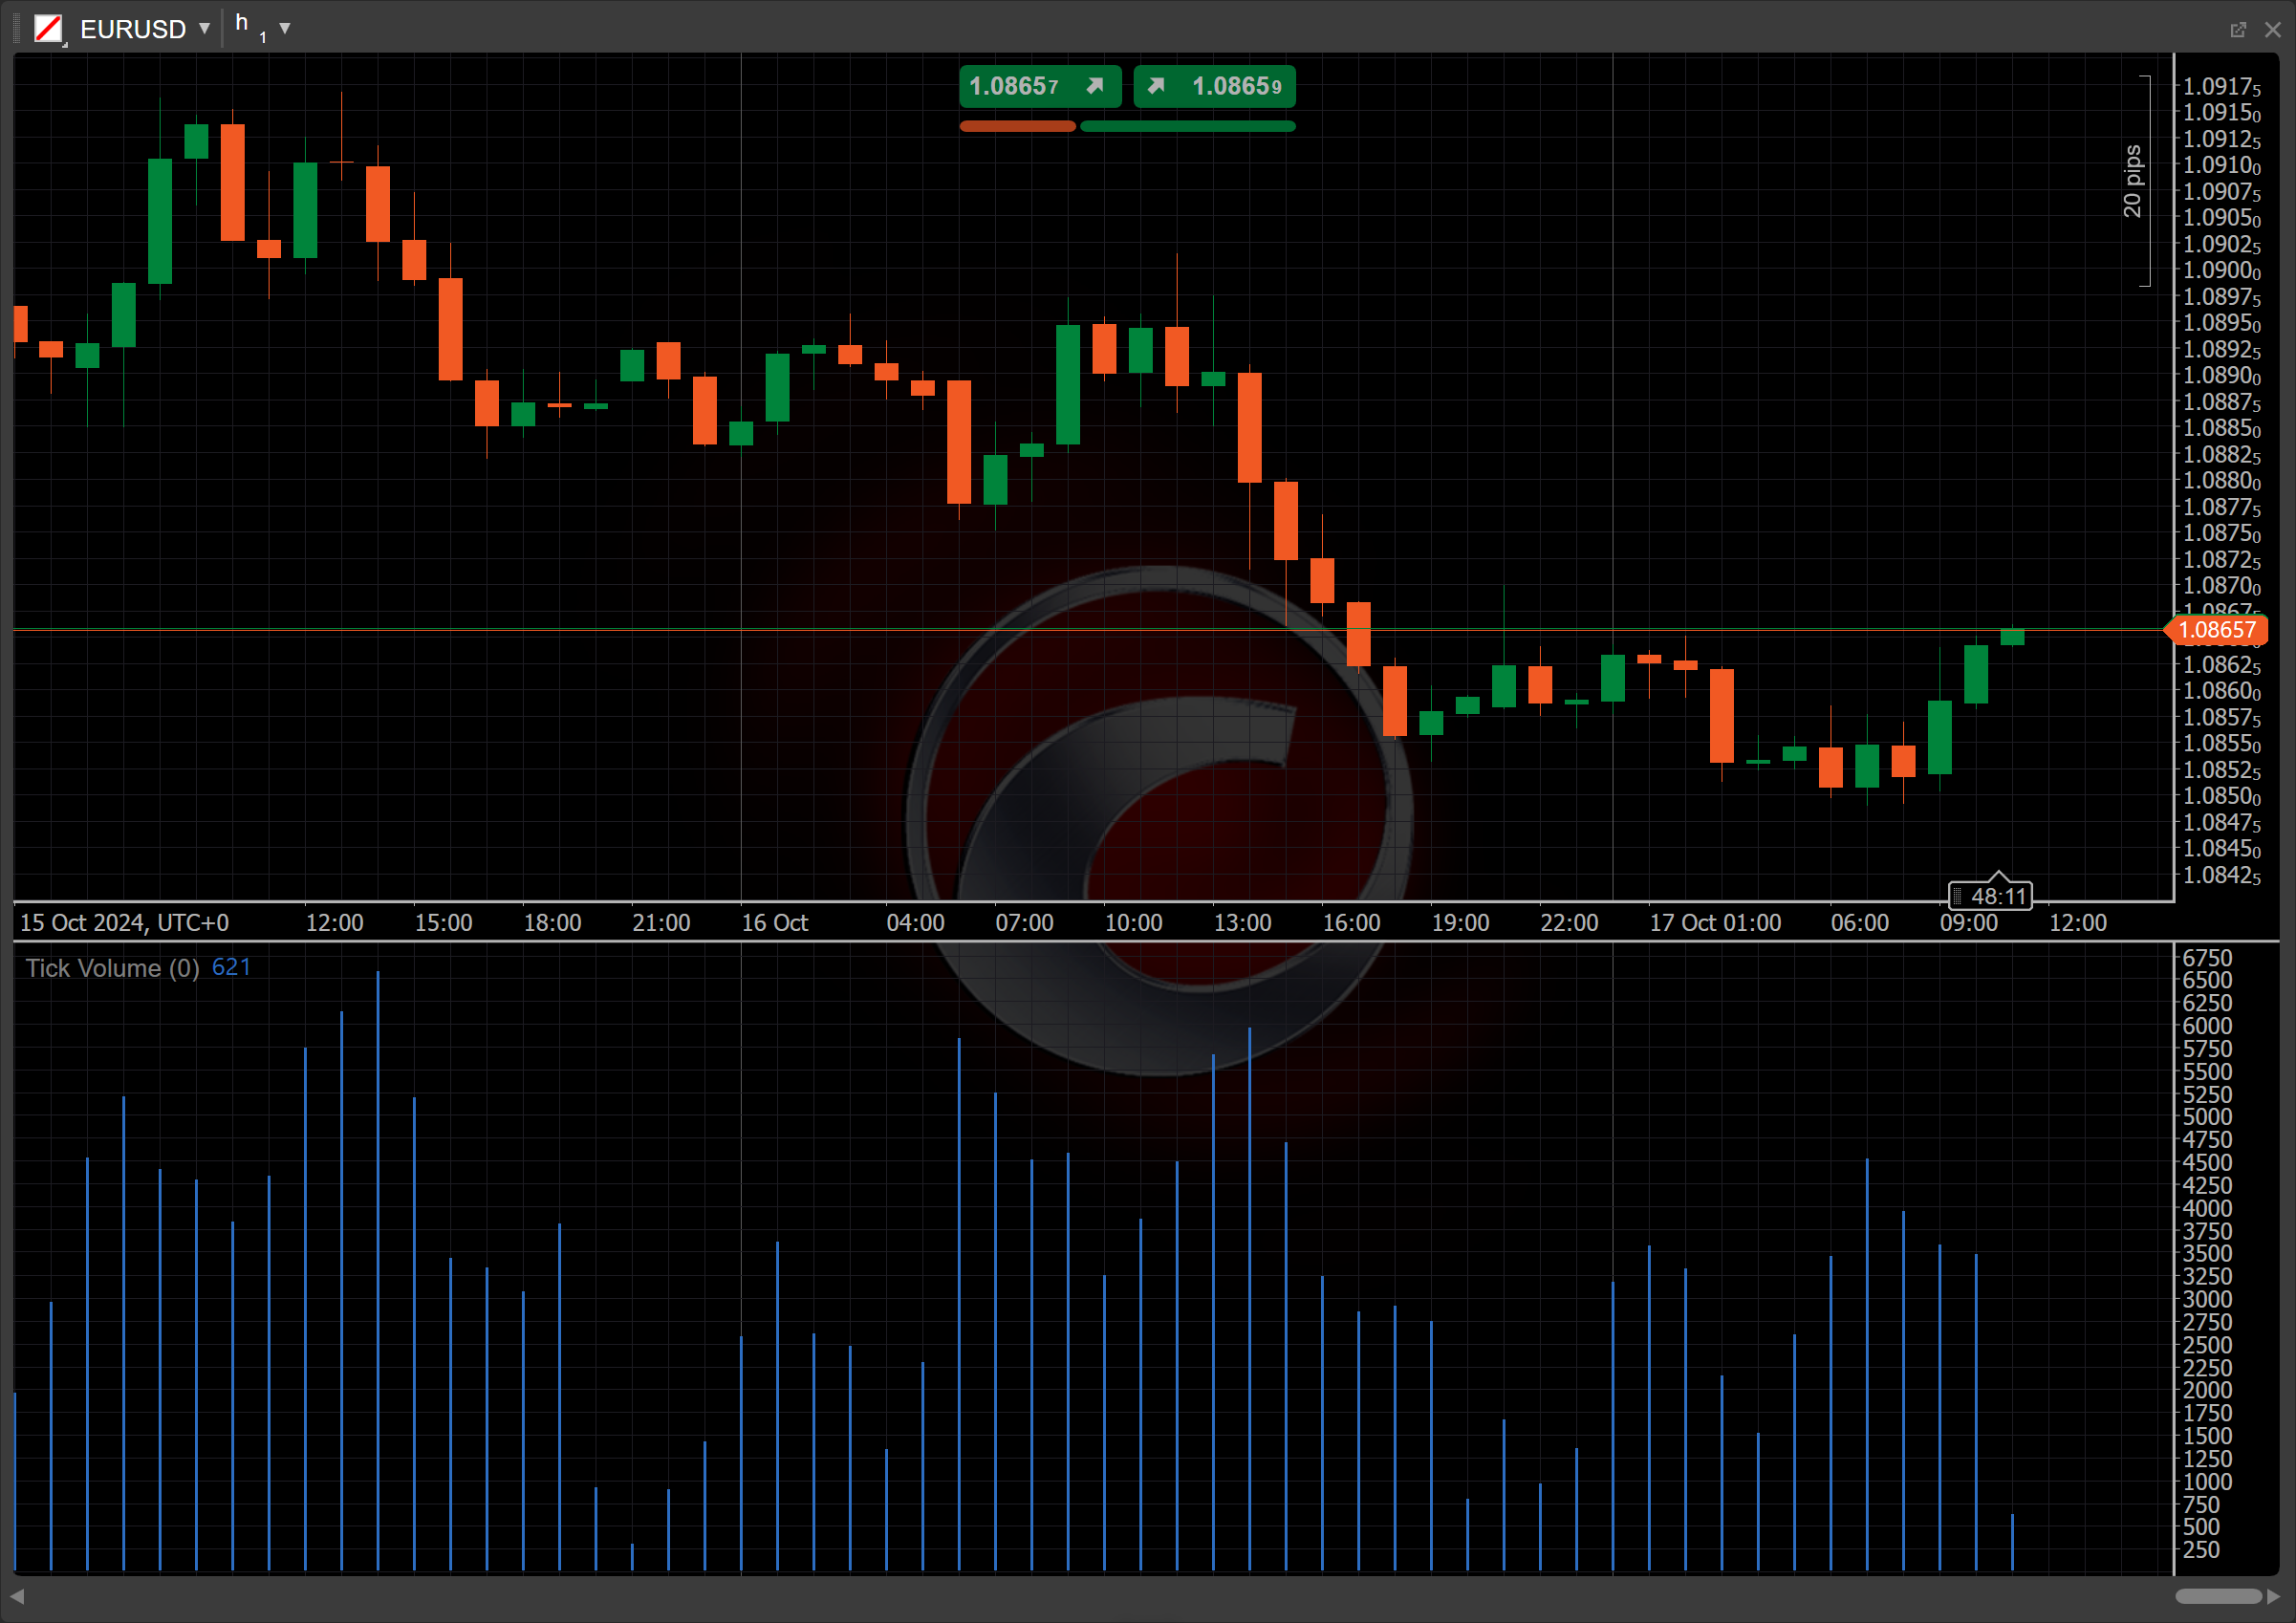
The Tick Volume is a technical indicator that measures the number of price changes (ticks) for a given asset within a specific period. Unlike traditional volume indicators, which track the number of shares or contracts traded, the Tick Volume counts the frequency of price movements, providing insights into market activity. A higher tick volume indicates increased market participation and potential volatility, while a lower tick volume suggests reduced activity. Traders use the Tick Volume to confirm price trends or reversals, as significant movements in tick volume may precede notable price changes.
History
The Tick Volume indicator gained prominence with the rise of electronic trading and forex markets, where traditional volume data is often unavailable. It provides an alternative measure of market activity by counting price changes. Traders began using the Tick Volume in the late 1990s to gauge market momentum and refine trade decisions.
Calculations
The Tick Volume is calculated by counting the number of price changes (ticks) that occur during a specified period and is updated with each price movement within that period.
Interpretation
-
Growing and shrinking bars – a growing Tick Volume suggests heightened market activity and increased momentum, potentially supporting a trend, while shrinking bars indicate reduced activity, signalling a possible decline in momentum or weakening of the current trend.
-
Divergence and convergence – when the price is making new highs or lows while the Tick Volume does not confirm the movement, it suggests a potential reversal. When both the price and the Tick Volume move in the same direction, it indicates strong trend support.
-
Breakouts – a significant spike in the Tick Volume during a price breakout often indicates strong conviction behind the movement, suggesting that the breakout may be sustained.
-
Shift – by adjusting the shift parameter to alter the alignment of the Tick Volume bars with price data on the chart, you can explore how the Tick Volume readings correspond to past or future price movements.
Application
-
Buy signal – when the closing price exceeds the previous close, and the Tick Volume increases, indicating rising market participation and potential upward momentum, consider buying.
-
Sell signal – when the closing price is lower than the previous closing price, and the Tick Volume rises, suggesting stronger bearish momentum, consider selling.
-
Exit strategies – you may decide to exit a position when the Tick Volume starts to shrink, indicating declining momentum, which suggests the trend might be losing strength. Alternatively, you can use the Tick Volume spikes during volatile price movements as an alert to lock in profits.
-
Confirming trades – the Tick Volume is often used alongside trend-following indicators like moving averages or the Relative Strength Index (RSI). For example, an increasing Tick Volume during a moving average crossover can confirm the strength of a new trend. Additionally, traders use the Tick Volume divergence to detect potential reversals when the price is rising, but the Tick Volume is declining.
Note
You can take advantage of algo trading, with cBots executing trades based on the signals from this indicator, as shown in our examples. Learn more about how to use indicators in cBots.
Limitations
The Tick Volume reflects the frequency of price changes, not the actual traded volume, which may limit its accuracy in certain markets. It can also generate false signals during low liquidity periods or erratic market conditions. Additionally, it may not fully represent institutional trading activity.
Summary
The Tick Volume indicator measures market activity by counting price changes (ticks) over a specific period. It offers insights into momentum, trend strength, and potential reversals. Though useful for confirming trends and detecting breakouts, it reflects price movements rather than actual trade volume, which may limit its reliability, especially in volatile or low-liquidity markets.