Trade Volume Index
Definition
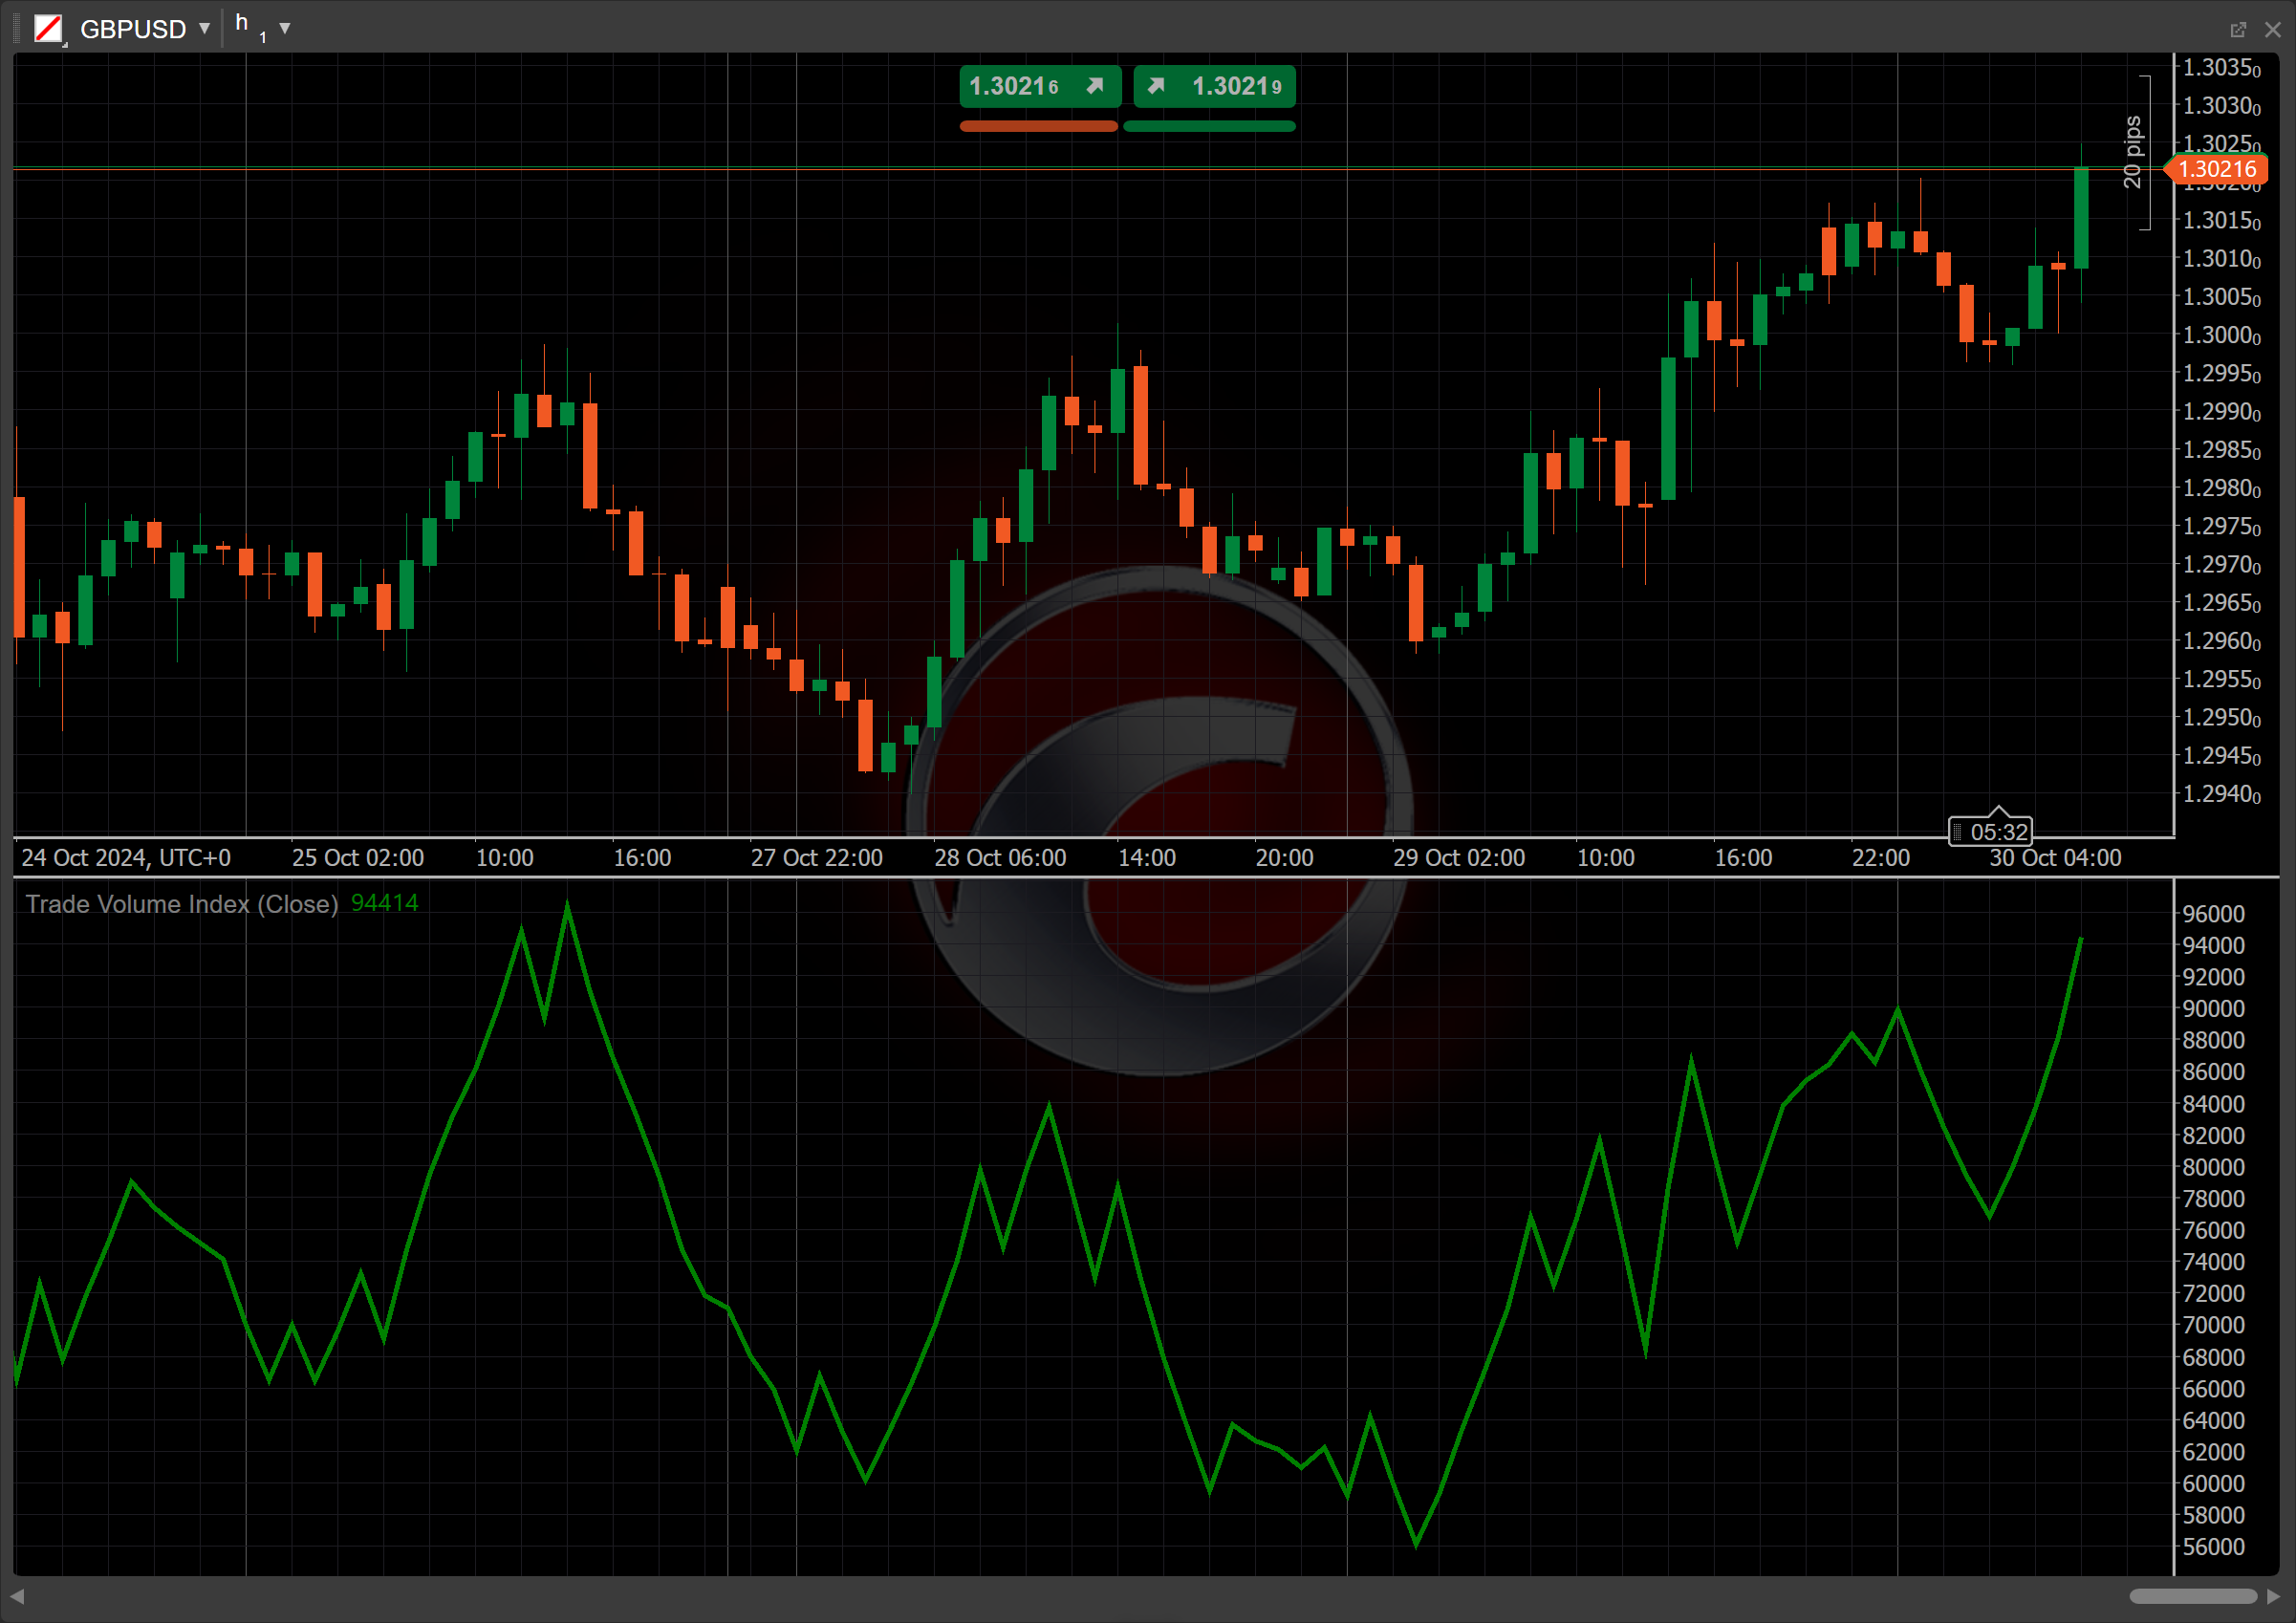
The Trade Volume Index (TVI) is a technical indicator that measures the flow of money based on price changes and volume. It helps identify whether buyers or sellers dominate by accumulating volume when prices rise and subtracting it when prices fall. Unlike traditional volume indicators, the TVI emphasises price confirmation through volume movements, aiding in trend analysis and reversals.
History
The TVI was introduced to combine price action with volume, providing insights into market sentiment and momentum. It was popularised in the 1970s by Richard W. Arms Jr., known for his work on volume-based indicators and gained further traction in the 1980s when traders sought tools to better interpret volume data alongside price trends.
Calculations
The TVI indicator is calculated using the following formula:
-
\( TVI = { TVI_{prev} + TickVolume } \) if the direction of TVI is accumulative, such as the price has increased significantly (greater than \(Pip\))
-
\( TVI = { TVI_{prev} - TickVolume } \) if the direction of TVI is distribute, such as the price has decreased significantly (less than -\(Pip\))
-
\( TVI = { TVI_{prev} } \) if change in price is between \(Pip\) and -\(Pip\)
\(TVI\) – the current Trade Volume Index level
\(TVI_{prev}\) – the previous Trade Volume Index level
\(TickVolume\) – the current tick volume
\(Pip\) – the unit of price movement for the symbol
Interpretation
The initial value of the TVI is typically set at zero, serving as the baseline for subsequent calculations.
The following interpretations of the indicator are generally applicable:
-
Crossovers – the TVI crossovers with a moving average (such as the Simple Moving Average (SMA)) can generate trade signals. A crossover above the SMA suggests an emerging uptrend, while a crossover below indicates a potential downtrend.
-
Rising and falling – a rising TVI reflects growing buying momentum, whereas a falling TVI indicates increasing selling pressure.
-
Divergence and convergence – divergence between the TVI and the price can signal potential trend reversals. For example, if the price rises but the TVI falls, it may indicate weakening buying strength.
-
Reversal points – sudden changes in the TVI direction, especially near extremes, can act as early indicators of potential market reversals.
Application
-
Buy signal – when the TVI crosses above a moving average, indicating increasing buying pressure and the potential start of an uptrend, it may prompt traders to enter a long position.
-
Sell signal – when the TVI crosses below a moving average, suggesting rising selling pressure and the potential for a downtrend, it may prompt traders to enter a short position.
-
Stop-loss placement – it is recommended to set a stop loss above recent highs for buy positions and below recent lows for sell positions. Additionally, consider a tighter stop loss in cases of the TVI divergence from price action, and implement a trailing stop loss to secure profits as trends develop.
-
Exit strategies – exiting positions when the TVI reverses direction or crosses back below or above the moving average can help lock in profits and reduce exposure to trend reversals.
-
Confirming trades – the TVI works well with trend-following indicators like moving averages or momentum indicators. For example, pairing it with the Relative Strength Index (RSI) can help confirm whether buying or selling signals are supported by volume trends, adding confidence to trades.
Note
You can take advantage of algo trading, with cBots executing trades based on the signals from this indicator, as shown in our examples. Learn more about how to use indicators in cBots.
Limitations
The Trade Volume Index has limitations, including its reliance on historical price and volume data, which may not accurately predict future price movements. It can generate false signals in volatile markets and may lag in rapidly changing conditions. Additionally, the TVI should not be used in isolation; combining it with other indicators is essential for a comprehensive analysis.
Summary
The Trade Volume Index is a valuable technical indicator that measures buying and selling pressure through the relationship between price movements and volume. By identifying trends and confirming market sentiment, the TVI is particularly useful for spotting potential reversals and assessing market strength. To maximise its effectiveness, traders should complement the TVI with other market insights and indicators to improve their overall strategy.