Volume Oscillator
Definition
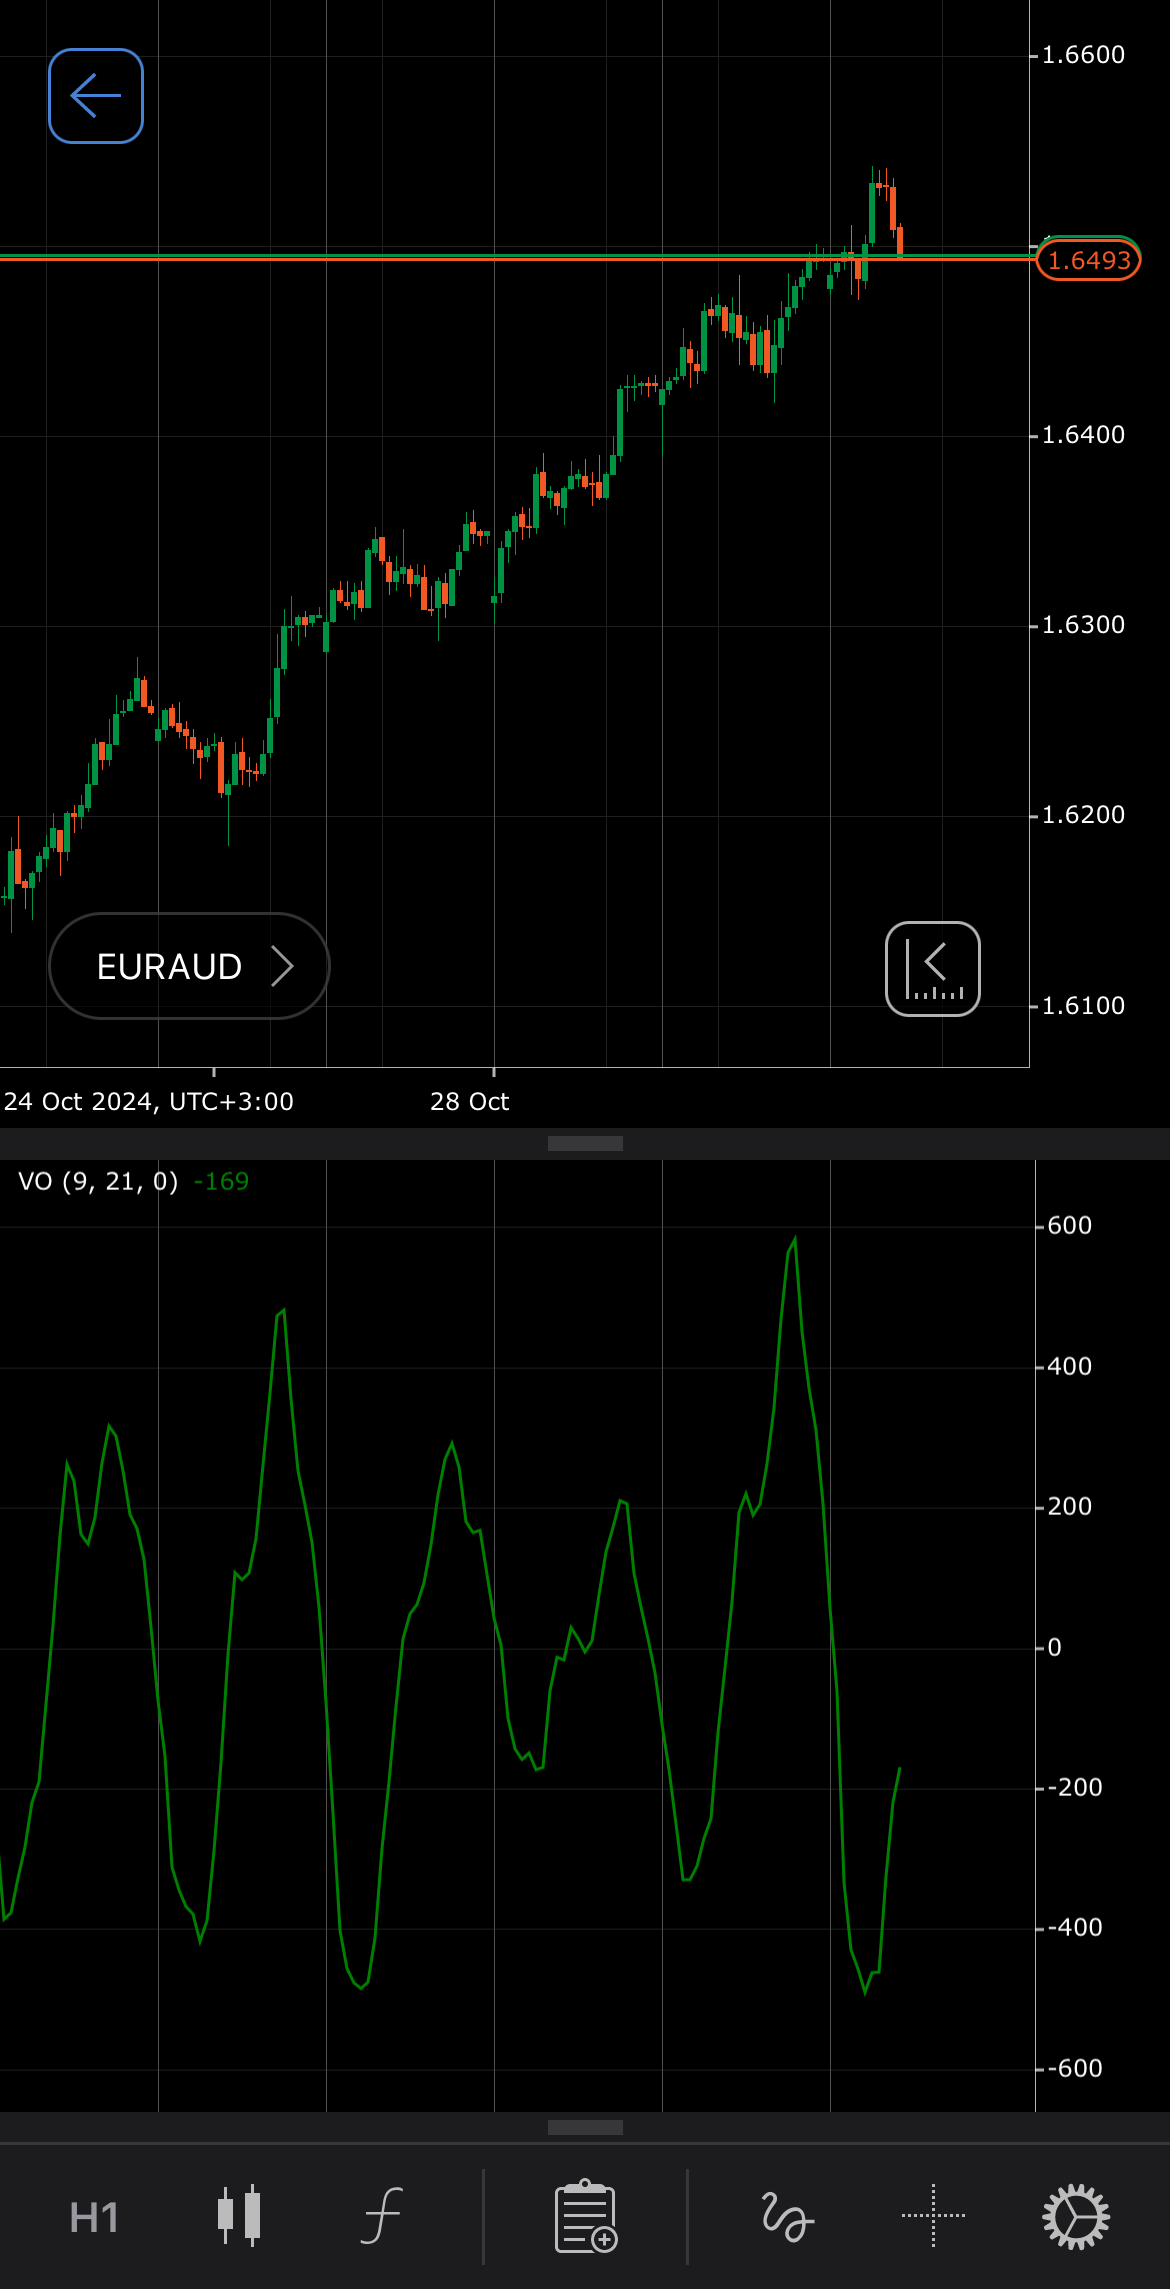
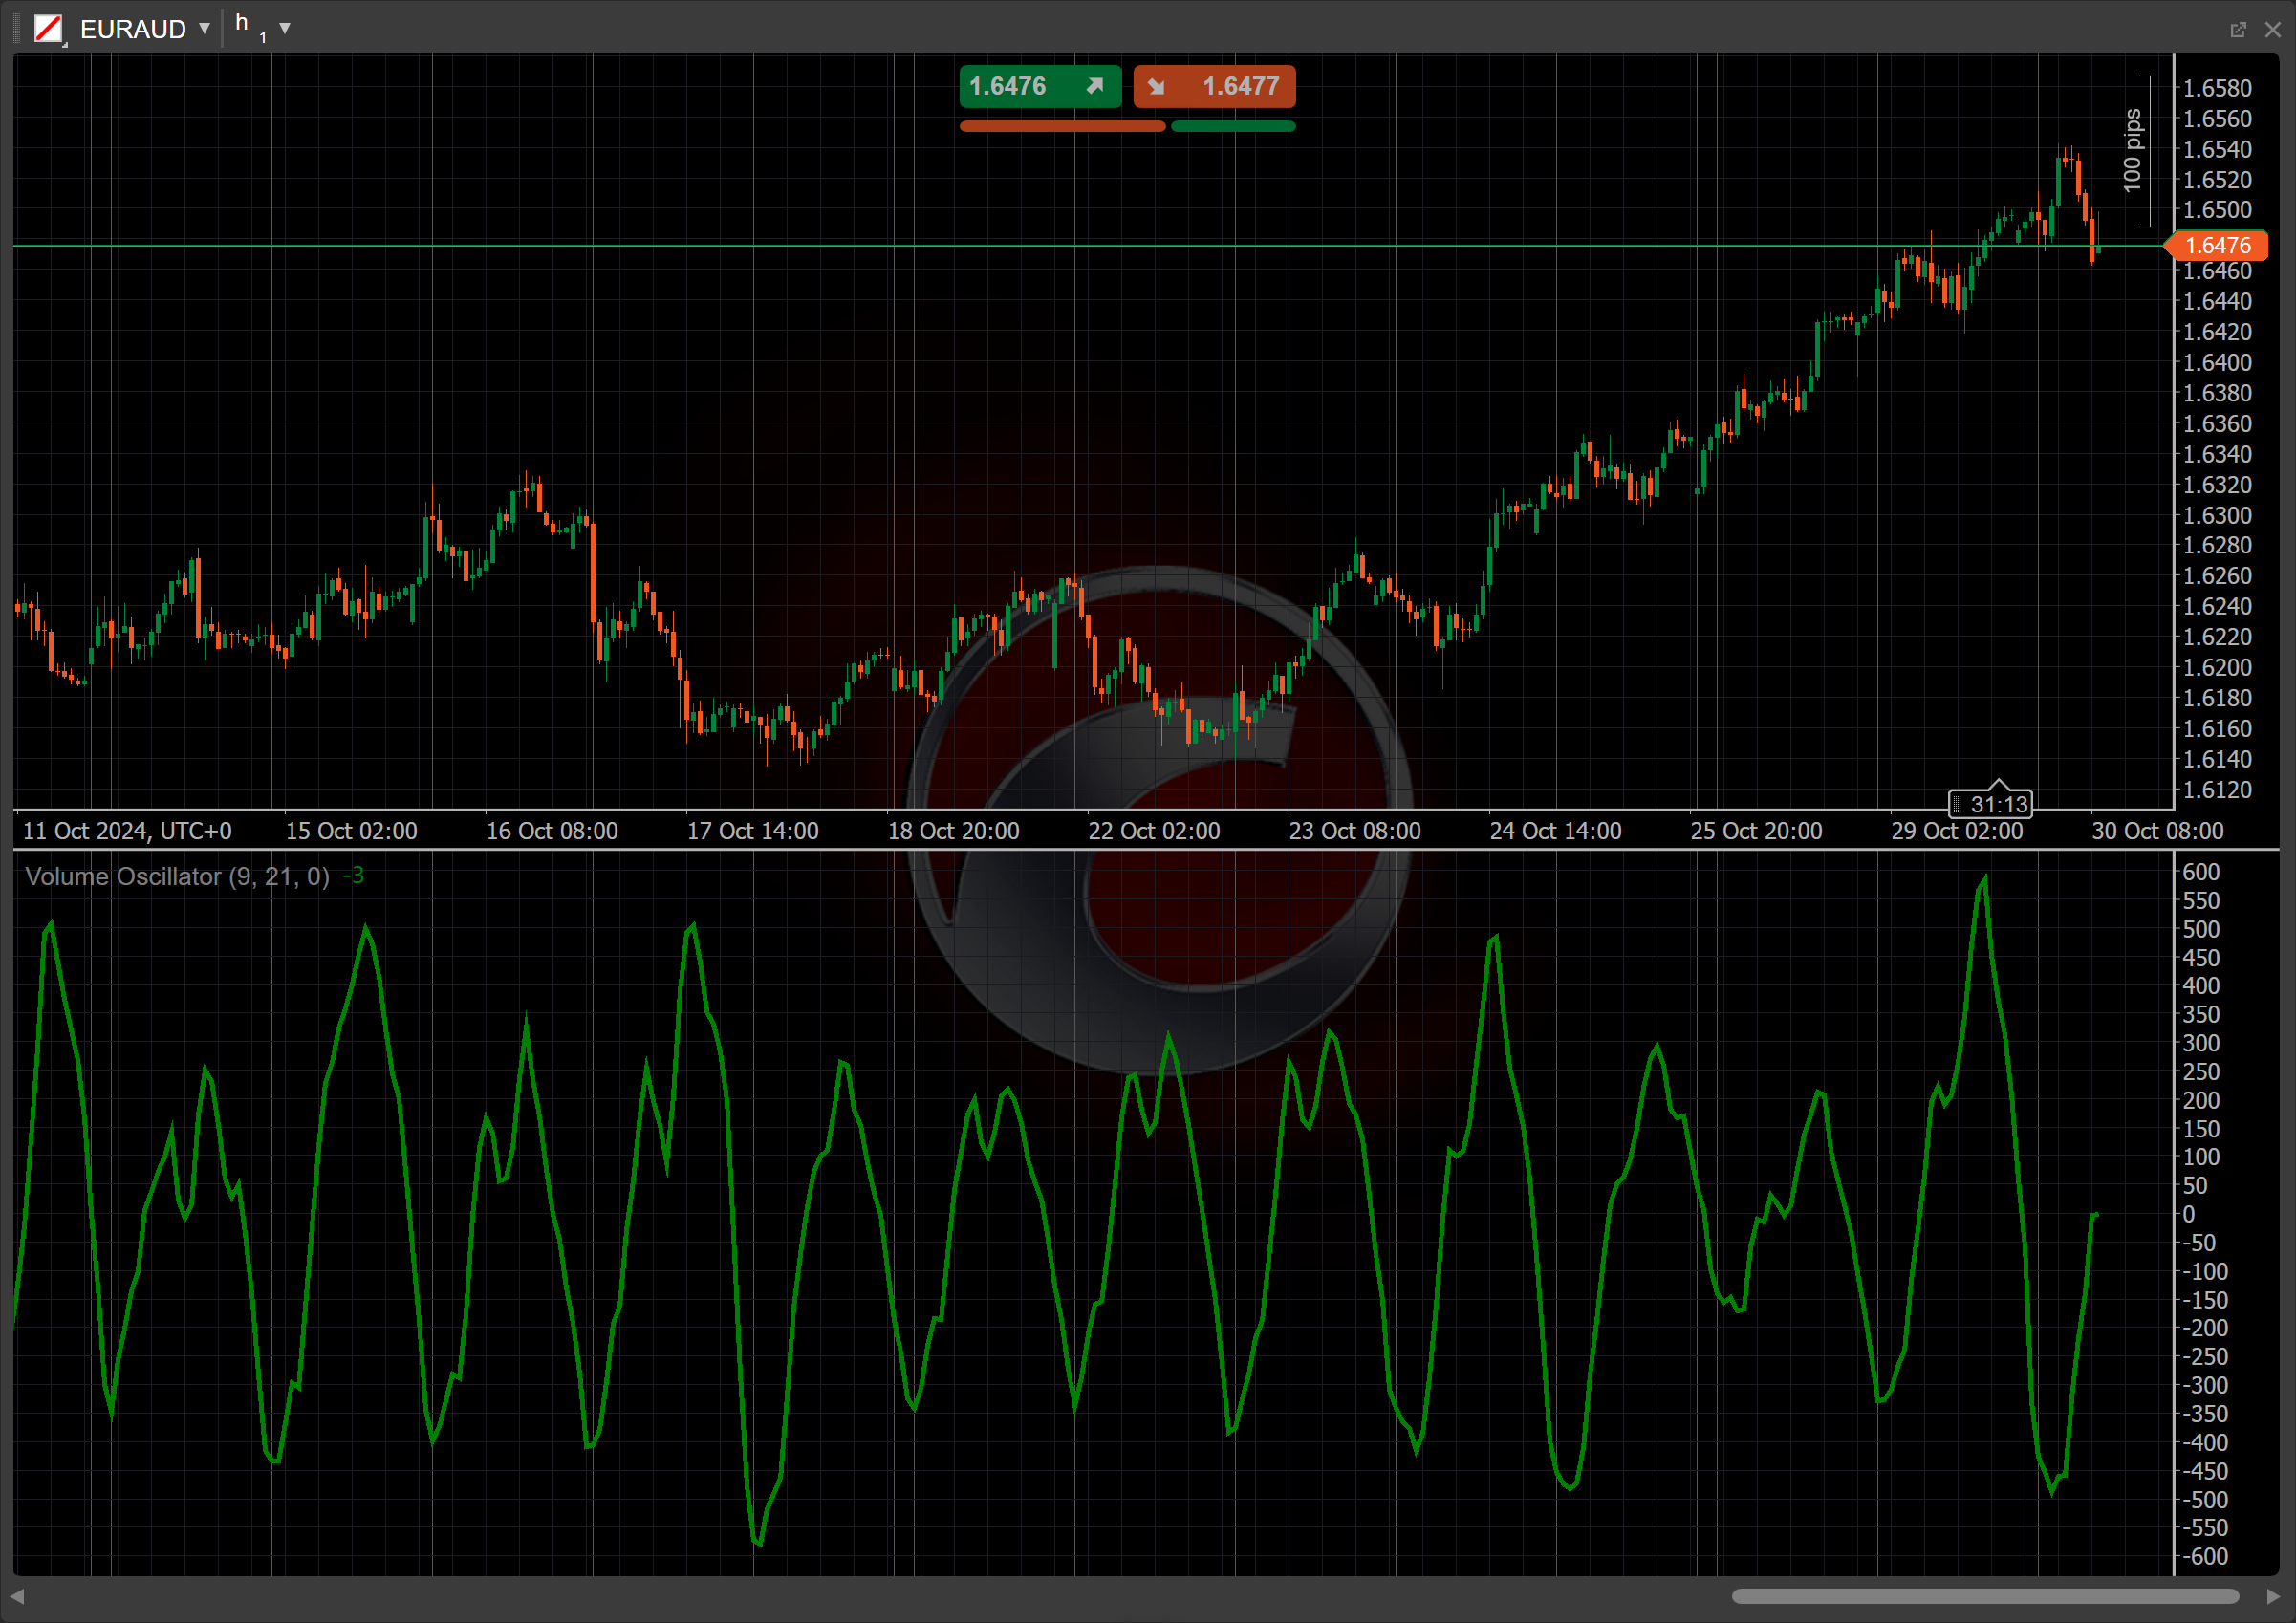
The Volume Oscillator is a technical indicator that measures the difference between two Simple Moving Averages (SMAs) of trading volume. It helps identify trends in volume momentum by comparing short-term and long-term volume movements. A positive oscillator indicates increasing buying pressure, while a negative value suggests decreasing volume activity. Traders often use it to assess the strength of price movements and to spot potential reversals or continuations in market trends.
History
The Volume Oscillator was developed as part of the growing interest in volume analysis in technical trading. It gained traction in the late 20th century, particularly with the advent of computerised trading platforms that allowed for the easy calculation of volume metrics. Although the specific origin remains unclear, it has been referenced in various trading literature and technical analysis courses, reflecting the evolving understanding of market dynamics.
Calculations
The Volume Oscillator value is determined by subtracting the long-term SMA from the short-term SMA:
\[ Volume\ Oscillator = { SMA_{ShortTerm} - SMA_{LongTerm} } \]
\(SMA_{ShortTerm}\) – the SMA of the tick volume over the shorter period
\(SMA_{LongTerm}\) – the SMA of the tick volume over the longer period
Interpretation
The Volume Oscillator is most commonly used with a 9-period SMA for the short term and a 21-period SMA for the long term.
The main patterns of the oscillator behaviour can be interpreted as follows:
-
Zero-line crossover – a crossover of the Volume Oscillator above the zero line indicates a shift to bullish volume momentum. Conversely, a crossover below the zero line signifies bearish volume momentum.
-
Rising and falling – a rising Volume Oscillator indicates increasing volume momentum, often aligning with strong price trends. It suggests that the current price movement may continue. A falling Volume Oscillator signals decreasing volume momentum, which can indicate a potential weakening of the current trend.
-
Divergence and convergence – if prices are making new highs while the Volume Oscillator is making lower highs, it may signal weakening momentum and a potential reversal. Convergence, where both the price and the oscillator move in the same direction, typically indicates strength in the current trend.
-
Reversal points – if the oscillator shifts from positive to negative or vice versa while prices are near key support or resistance levels, it may suggest that a reversal is imminent.
-
Shift – by adjusting the shift parameter to alter the alignment of the Volume Oscillator indicator with price data on the chart, you can explore how the Volume Oscillator readings correspond to past or future price movements.
Application
-
Buy signal – consider placing a buy order when the Volume Oscillator crosses above the zero line, indicating a shift to bullish volume momentum. Additionally, if the oscillator is rising and the current price closes above the short-term SMA, it strengthens the buy signal.
-
Sell signal – consider placing a sell order when the Volume Oscillator crosses below the zero line, indicating a shift to bearish volume momentum. This signal is further validated if the oscillator is falling while the price closes below the short-term SMA.
-
Stop-loss placement – a stop loss can be placed just below the most recent swing low for buy positions or above the most recent swing high for sell positions, helping traders manage risk while using the Volume Oscillator to identify volume momentum shifts.
-
Exit strategies – you can exit buy positions when the Volume Oscillator crosses back below the zero line or when it shows signs of divergence with price action, indicating a potential reversal. For sell positions, you can exit when the oscillator crosses back above the zero line or shows divergence with price action.
-
Confirming trades – the Volume Oscillator can be combined with other indicators, such as the Relative Strength Index (RSI) or the Moving Average Convergence Divergence (MACD). For instance, a buy signal from the Volume Oscillator can be confirmed by the RSI being below 30 (oversold) or by a bullish crossover in the MACD.
Note
You can take advantage of algo trading, with cBots executing trades based on the signals from this indicator, as shown in our examples. Learn more about how to use indicators in cBots.
Limitations
The Volume Oscillator can generate false signals, especially in choppy or sideways markets where volume trends are less reliable. Additionally, it relies solely on volume data, which can lag behind price movements. Traders should be cautious and consider using it alongside other indicators to confirm signals and avoid potential pitfalls associated with volume analysis.
Summary
The Volume Oscillator is a convenient tool for traders seeking insights into volume dynamics and market strength. By comparing short- and long-term volume trends, it aids in identifying potential buying or selling pressure. A positive oscillator indicates bullish momentum, while a negative value reflects bearish sentiment. This indicator enhances decision-making by providing a clearer picture of market activity, making it a staple for many traders who analyse price movements and volume together for informed trading strategies.