Volume Rate of Change
Definition
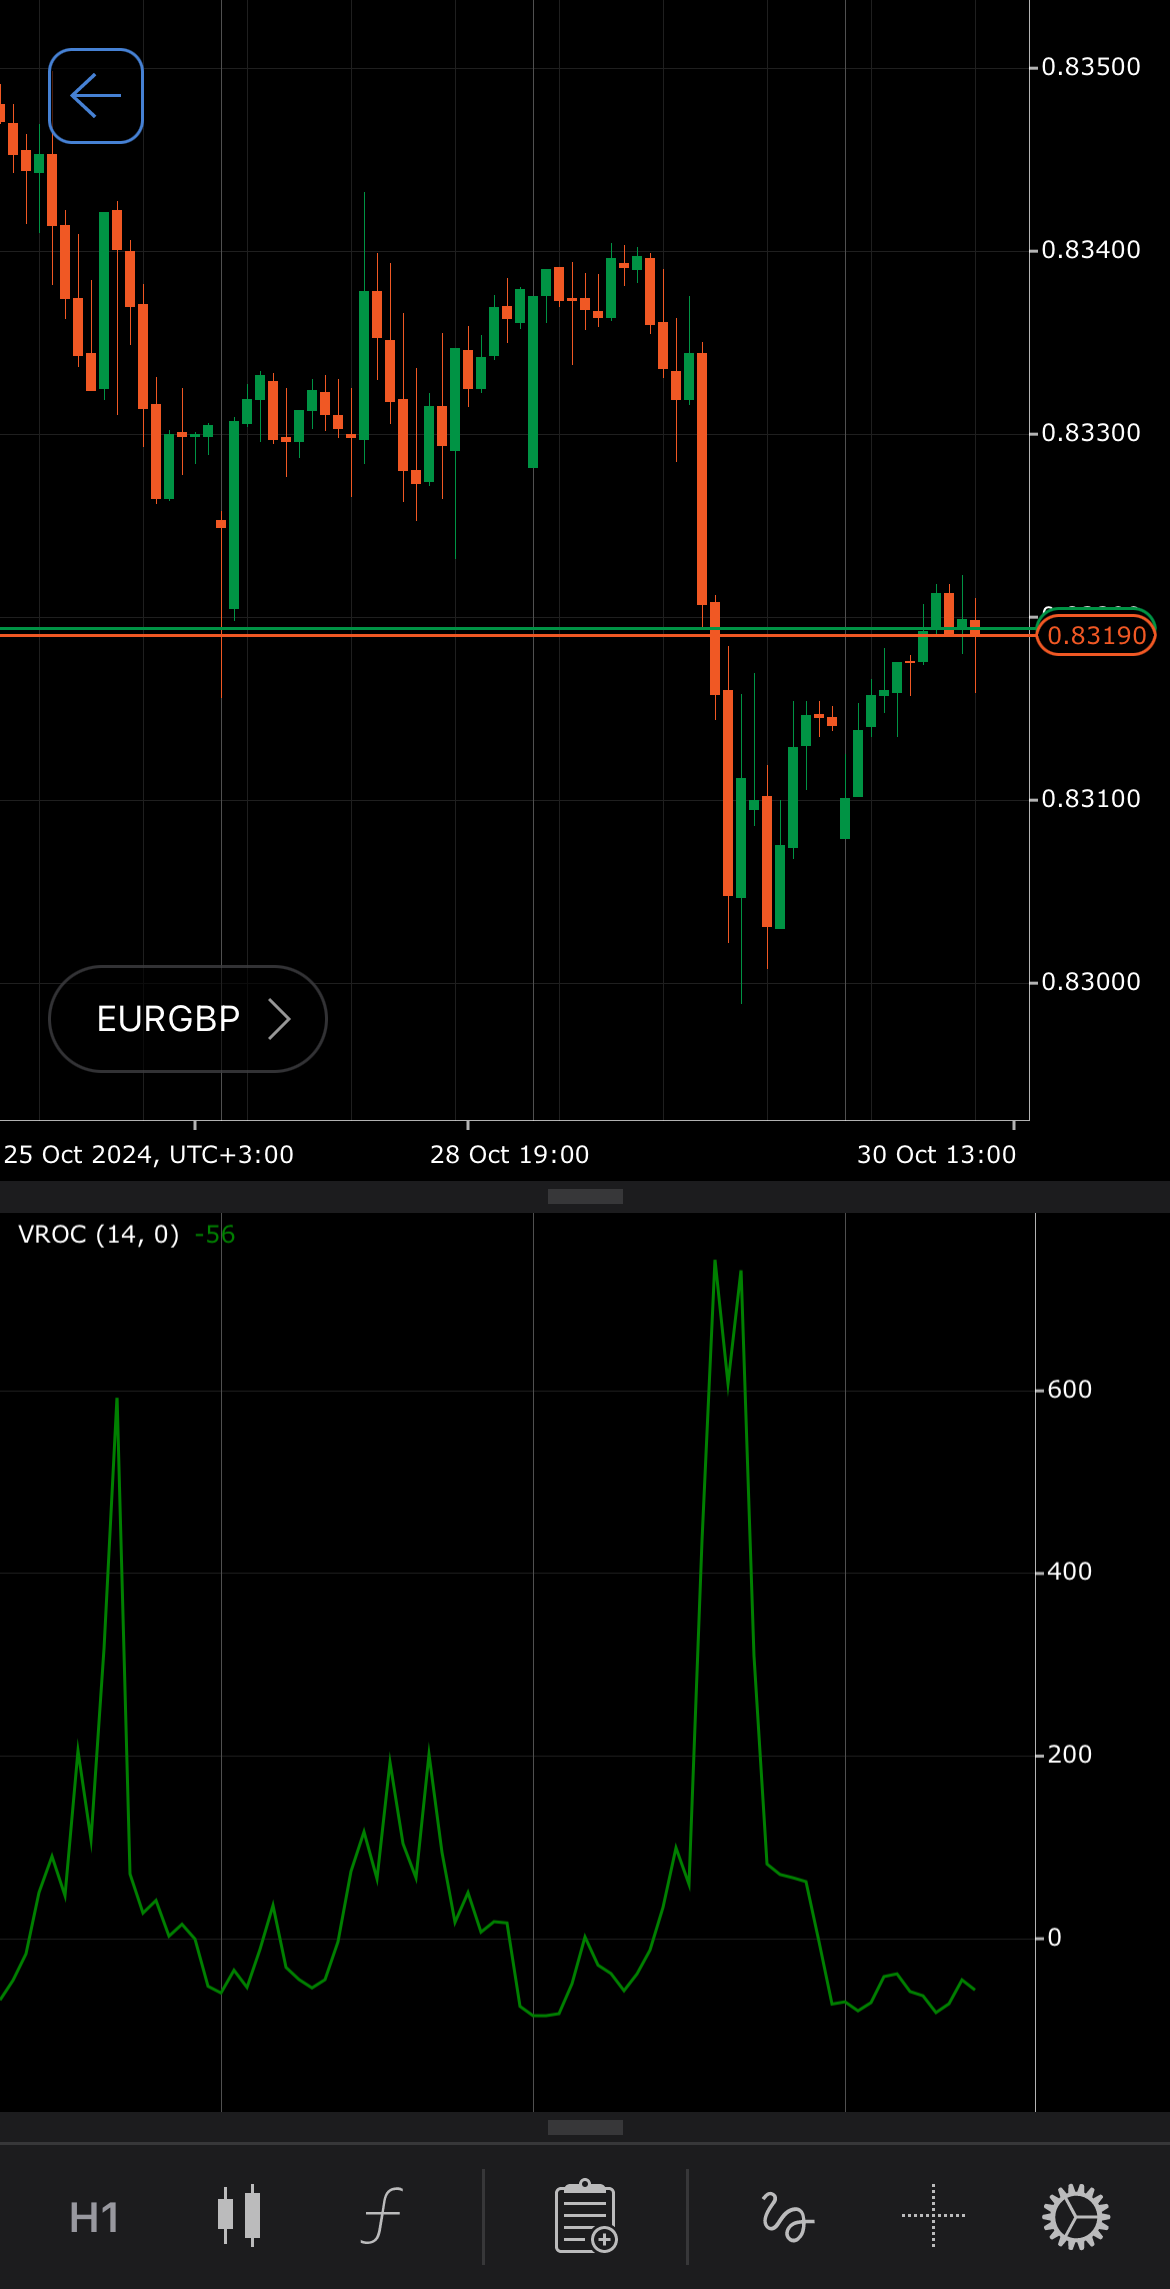
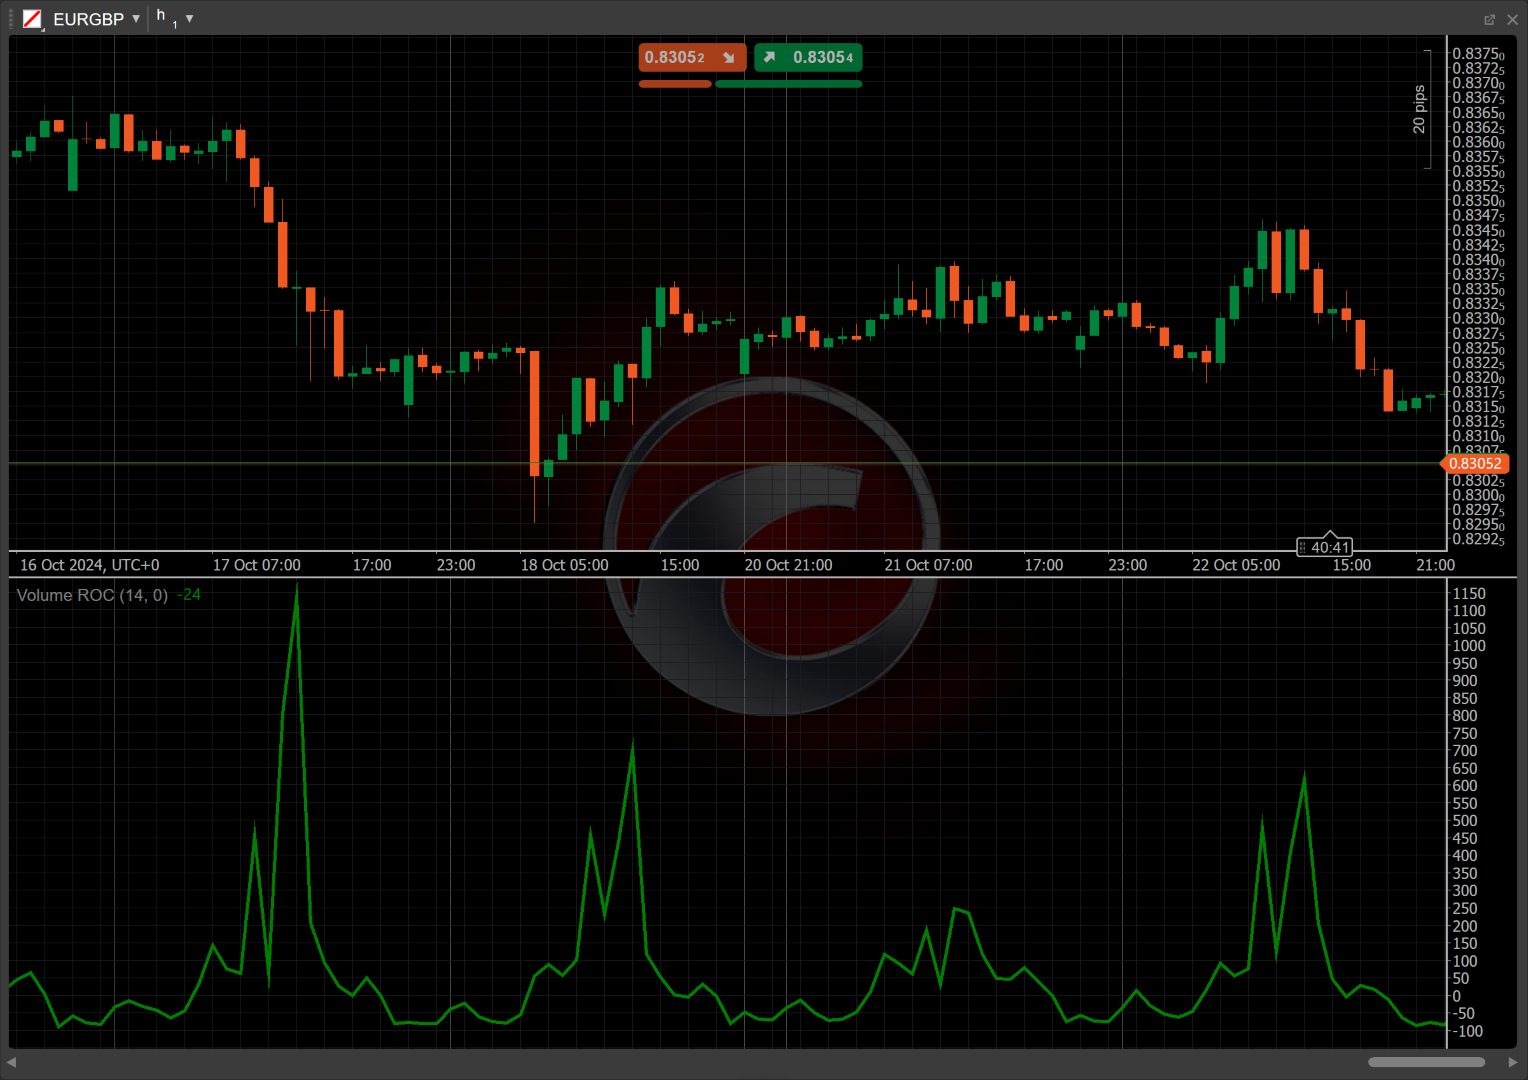
The Volume Rate of Change (ROC) is a technical indicator that measures the percentage change in trading volume over a specified period. It compares the current volume with the volume from a previous period to quantify changes in market activity. The indicator helps highlight increases or decreases in trading volume, providing a numerical representation of volume dynamics over time.
History
The Volume ROC indicator, part of the broader ROC family, was developed as technical analysis gained popularity in the mid-20th century. It originated from efforts to quantify changes in trading volume and price movement in forex markets. Analysts and traders in the 1970s began adopting it to track volume shifts in currency trading, incorporating it into broader technical strategies to better assess market momentum and activity.
Calculations
The Volume ROC is calculated using the following formula:
\[ Volume\ ROC = { { { Current\ Volume - Volume\ n\ periods\ ago } \over { Volume\ n\ periods\ ago } } \times 100 } \]
\(Current\) \(Volume\) – the tick volume at the current period
\(Volume\) \(n\) \(periods\) \(ago\) – the tick volume at \(n\) periods earlier
\(n\) – lookback period
Interpretation
By default, the Volume ROC is calculated with a 14-period lookback.
The main patterns of the indicator behaviour can be interpreted as follows:
-
Zero-line crossover – when the Volume ROC crosses above the zero line, it indicates that the current trading volume has increased compared to the volume from a previous period. A crossover below the zero line signals a decrease in trading volume.
-
Rising and falling – a rising Volume ROC indicates increasing trading volume compared to a previous period, which could signal growing market interest or momentum. Conversely, a falling Volume ROC suggests a decrease in trading volume, potentially indicating reduced participation or waning momentum.
-
Reversal points – sharp changes in the Volume ROC may suggest potential reversal points in market activity. A sudden spike or drop in volume can indicate a shift in trend, or a transition from a consolidation phase to a new trend direction.
-
Breakouts – a strong increase in the Volume ROC can indicate the potential for a breakout, as rising volume often accompanies significant price movements. A sudden surge in trading volume may suggest traders are entering or exiting positions in response to key price levels.
-
Shift – by adjusting the shift parameter to alter the alignment of the Volume ROC indicator with price data on the chart, you can explore how the Volume ROC readings correspond to past or future price movements.
Application
-
Buy signal – traders can look for buying opportunities when the Volume ROC crosses above the zero line, indicating that trading volume is increasing, often accompanying bullish market momentum. This increase in volume may suggest stronger interest in a currency pair and can confirm a potential upward price movement.
-
Sell signal – traders can look for selling opportunities when the Volume ROC crosses below the zero line, reflecting a decrease in volume. This can suggest weakening market momentum or bearish conditions, signalling traders to consider selling or shorting a currency pair.
-
Confirming trades – the Volume ROC can be used alongside trend indicators like moving averages or the MACD to confirm trade signals. For example, a buy signal is triggered when the price crosses above its Simple Moving Average (SMA), and the Volume ROC is above its SMA, indicating rising volume and strengthening momentum, which helps validate the price trend.
Note
You can take advantage of algo trading, with cBots executing trades based on the signals from this indicator, as shown in our examples. Learn more about how to use indicators in cBots.
Limitations
The Volume ROC can be overly sensitive to short-term volume spikes, leading to false signals, especially in volatile or illiquid markets. It does not account for price movement, potentially causing misleading interpretations if used alone. Furthermore, market anomalies like news events or large one-off trades can distort the indicator, necessitating cross-verification with other tools for reliable insights.
Summary
The Volume ROC indicator is an insightful tool that tracks the percentage change in trading volume over a set period, helping traders assess shifts in market enthusiasm. By analysing volume trends, it aids in understanding whether there is increasing or decreasing participation in a market move. This indicator serves as a useful metric for assessing momentum strength, assisting traders in spotting potential market trends.