Andrews' pitchfork
Andrews' pitchfork is a technical tool that helps to identify possible support and resistance levels as well as potential breakout and breakdown levels with three parallel trend lines that look like a pitchfork.
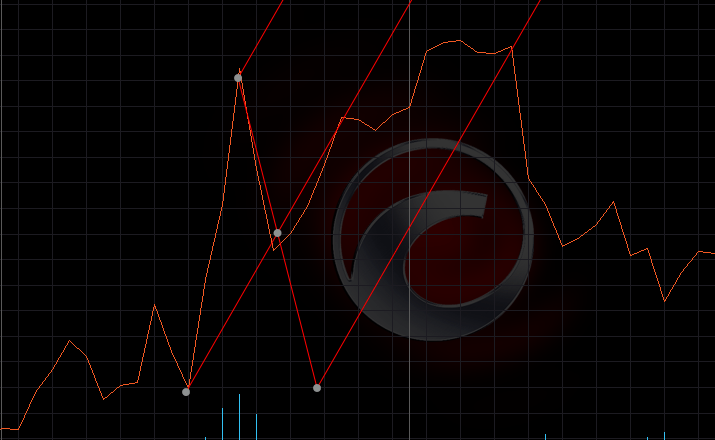
This tool, developed by Alan Andrews, uses trend lines that are created by selecting three points placed at three consecutive peaks and troughs at the start of confirmed trends, higher or lower.
Once the points are placed, a straight median line is drawn from the first point through the midpoint between the upper and lower points. The tool automatically draws the upper and lower trend lines parallel to the median line.
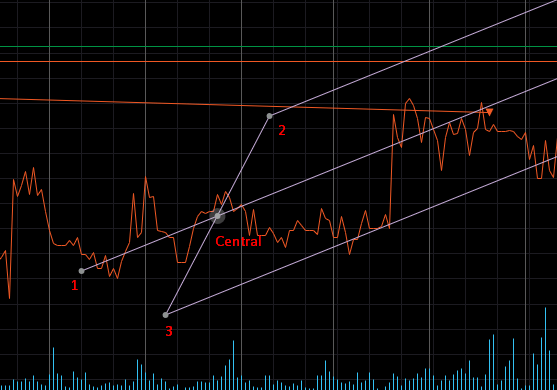
Andrews' pitchfork is built by the following scheme:
-
Point one is a starting point of the central trendline and an uptrend or a downtrend.
-
Points two and three are the reaction high and low in the uptrend or downtrend, therefore the distance between them is the channel width.
-
The channel width line is crossed by the central trendline in the central point.
Andrews' pitchfork is convenient in defining support and resistance. A long position can be entered when the price reaches the bottom trend line. On the contrary, a short position can be entered when the price hits the upper trend line. The profits may be booked when the price reaches the opposite side of the pitchfork.
Before entering a position, ensure that support or resistance is holding at these levels. Price should reach the median trend line frequently when a security is trending and, when that does not happen, it may indicate an acceleration in the trend.
Andrews' pitchfork can also be used to trade breakouts (above the upper trend line) and breakdowns (below the lower trend line). However, in this situation, you should pay close attention to the head fakes and apply indicators (such as the On Balance Volume) to estimate the strength or weakness of the breakout or breakdown.
Note
You should have special skills and experience to use this tool, as the effectiveness of indicators depends on selecting the most reliable three points.
Traders and investors can optimise this task by experimenting with different reactionary highs and lows, constructing and reconstructing the indicator to identify the most effective price points.
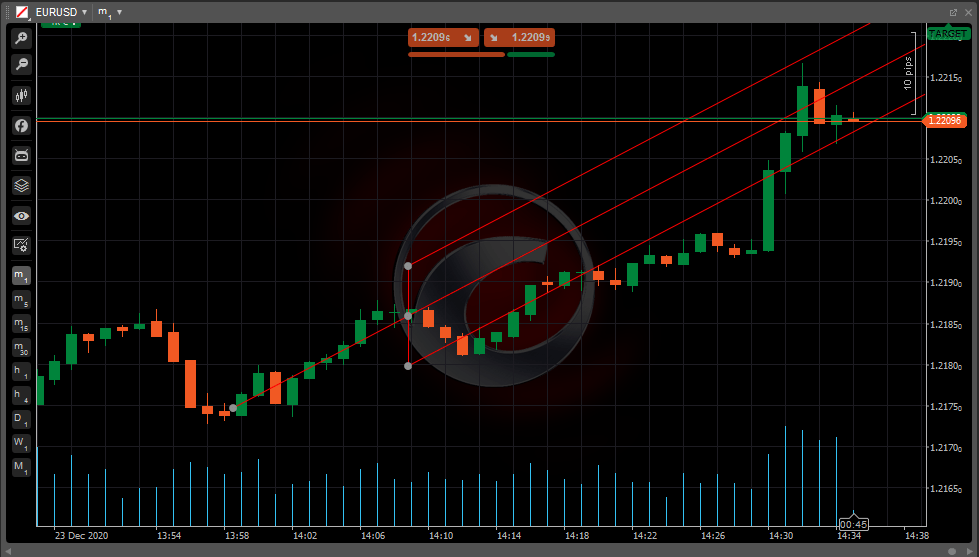
In cTrader, the preset Andrews' pitchfork tool is available in the toolbar. You can draw it on the chart, move it, rotate it and customise it as needed.
You can find a detailed description of how to use it in this documentation.