Fibonacci expansion
Fibonacci expansion is a charting technique used to plot possible levels of support and resistance by tracking not only the primary trend but also the retracement.
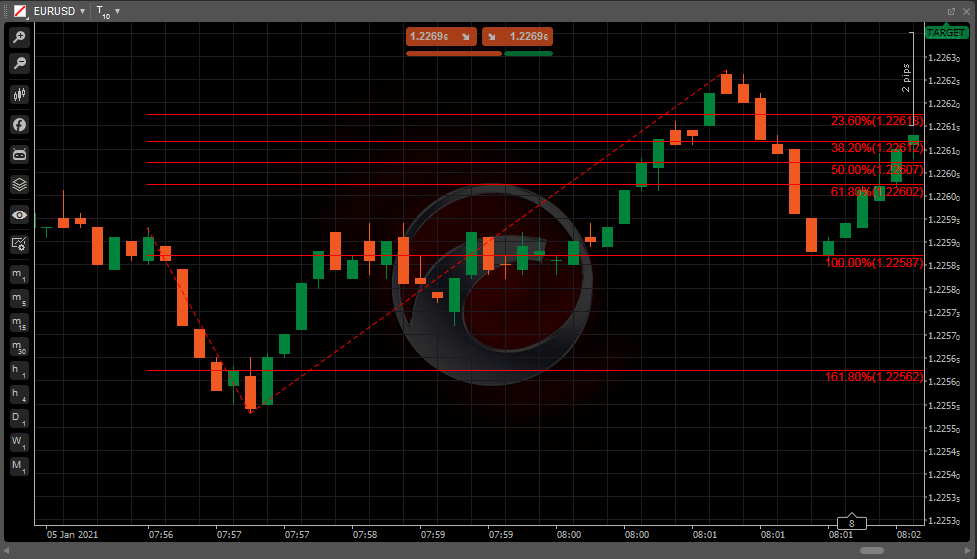
The tool is very similar to the Fibonacci retracement, but it is also intended to determine the end of the third wave. Unlike Fibonacci retracement, this tool is not built only on one trendline but on two.
While Fibonacci retracement applies percentages to a pullback, Fibonacci expansions apply percentages to a move in the trending direction. For example, a symbol's price goes from $5 to $10 and then goes back to $7. The move from $10 to $7 is a retracement. If the price starts rallying again and goes to $16, that is an expansion. In other words, Fibonacci retracements count the pullbacks within one trend, while Fibonacci expansion measures the impulse waves in the direction of the trend.
The tool can be used to establish profit targets or estimate how far a price may travel after a pullback ends. Expansion levels are also possible areas where the price may reverse.
Expansion is drawn on a chart to indicate potentially significant price levels. These levels are based on Fibonacci ratios as well. When the first line is drawn, its height is considered as a unit interval later on. The end of the second wave serves as a reference point for building an invisible vertical line. The corresponding lines are drawn from the reference point on the levels equal to 23.6%, 38.2%, 50%, 61.8%, 100%, 161.8% and 261.8%.
Usage
Fibonacci expansion is usually applied where the other methods of finding support or resistance are not applicable. If the price moves through an expansion level, it may continue moving towards the next. The price itself may not stop or reverse exactly at the level, but the area around it may be important.
If a long position is opened and a new high occurs, Fibonacci expansion can help predict where the price may move. The same is applicable for short positions. Fibonacci expansion can help identify potential profit target levels.
You can use Fibonacci expansion for any period or market. Typically, clusters of Fibonacci levels indicate a price area that will be significant for the stock and the traders in their decisions. Since expansion levels can be drawn on different price waves over time, when multiple levels from these different waves converge at one price, that could be a very important area.
In cTrader, the preset Fibonacci expansion tool is available in the toolbar that allows drawing the tool on the chart, moving it and configuring it to suit your needs. You can find a detailed description of how to use it in the Fibonacci tools section of this documentation.
Flaws
It is a common practice to use Fibonacci expansion along with the other indicators or patterns when looking to determine price targets, as the tool is not supposed to be the only marker of whether to buy or sell.
Candlestick charts and price action are especially informative when trying to determine whether a stock is likely to reverse at the target price.
There is no guarantee that the price will grow or reverse at a specific Fibonacci expansion level. And even if it does, it is not evident before a trade is made. The price may move through many of the levels or not reach any of them.