Fibonacci fan
A Fibonacci fan is a charting tool that is used to estimate support and resistance levels by drawing the trend lines based on Fibonacci retracement levels. To determine the retracement levels, the price difference is divided at the low and high end by ratios based on the Fibonacci series, in cTrader, they are 38.2%, 50% and 61.8% respectively.
The lines formed by connecting the starting point for the base trendline and each retracement level create the Fibonacci fan. Once patterns are identified within a chart, they can be used to predict future price movements and future levels of support and resistance.
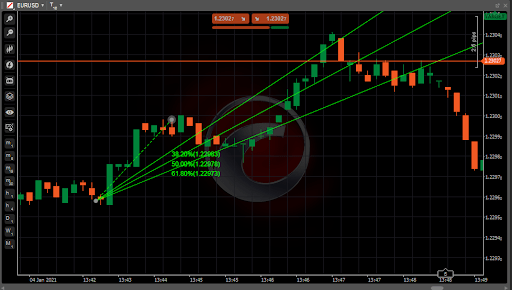
The example below shows the connection between the Fibonacci fan and the Fibonacci retracement levels.
If we draw a fan with the exact first two points of the retracement, we see the levels intersect at the corresponding levels. The 50% retracement line on the horizontal grid intersects with the 50% fan line and so on.
Usage
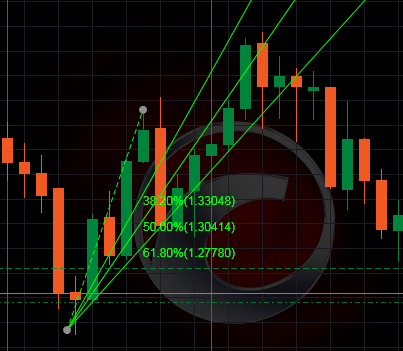
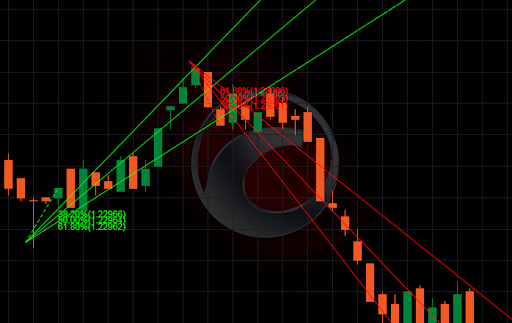
In a rising trend, the first point of the Fibonacci fan should mark the most significant recent low in the chart. The second point marks one of the first significant peaks in the lifting trend.
The second point is usually placed no more than halfway between the first point and the last point (most recent bar) in the chart.
After marking the first two points, the tool will automatically calculate the extension lines marked as 38.2%, 50% and 61.8%, which are the familiar Fibonacci ratios. The extension lines in the fan are markers for support and resistance. In the example below, the extension lines will normally provide support when the price is above the line and resistance when below.
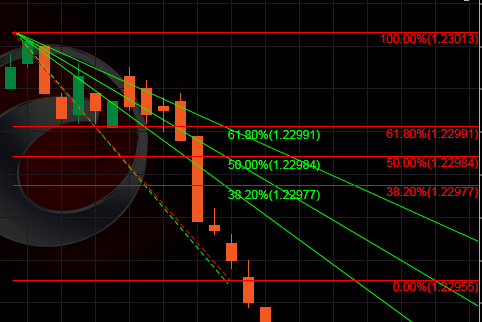
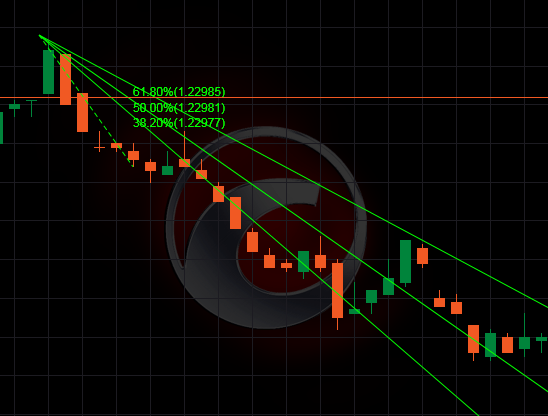
In a falling trend, the tool is applied in reverse. The first point marks a significant high and the second marks a significant low at the start of the trend. The fan lines that extend above the connecting line mark areas of resistance and support.
The most important step in drawing the Fibonacci fan is finding the correct markers for the first two points. They are often selected as extreme chart levels. The further the distance between the first two points, the more widely the fan’s trend lines will spread. Therefore, if the points are chosen too far or too close from each other, the tool will not have any practical use, as it will provide too few observations or produce an overly steep angle.
In the Fibonacci fan, even a small change in the placement of either of the two marker points can result in large movements further out in the extension lines. The trend lines usually become less accurate the further out it extends. That is why after marking the first two points and creating the fan, traders often create a secondary fan or several between various peaks and troughs, which may give a more complete picture of the likely areas of price reversals. It can help to predict the price behaviour within a smaller section of the chart.
In cTrader, you have a preset Fibonacci fan in your toolbar that allows drawing the tool on the chart, moving it and configuring it to suit your needs.
You can find a detailed description of how to use it in the Fibonacci tools section of this documentation.