Fibonacci retracement
Fibonacci retracement is a charting tool that uses horizontal parallel lines to indicate areas of the support or resistance at the key Fibonacci levels before the trend continues in the original direction.
Fibonacci retracement price levels can be used as buy triggers on pullbacks during an uptrend. The tool is used to determine how far the price might retrace before continuing to move in the original direction.
Traders often use Fibonacci key levels to place pending orders.
The Fibonacci retracement levels are based on Fibonacci numbers, the sequence, such that each number is the sum of the two preceding ones, but with each level associated with a percentage. Each percentage depicts how much of a prior move the price has retraced. In cTrader, the default Fibonacci retracement levels are 0%, 38.2%, 50%, 61.8%, and 100%.
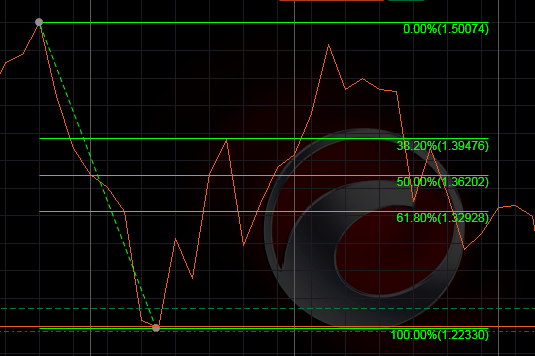
The main advantage of Fibonacci retracement is that it can be drawn between any two significant price points, such as a high and a low, then the tool will automatically create the levels between those two points and calculate the price automatically on each level.
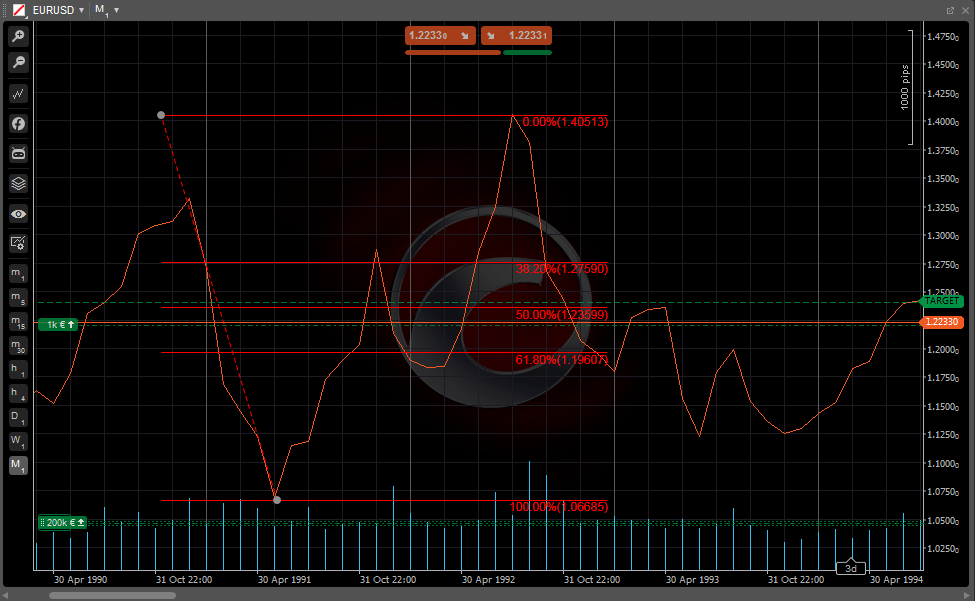
In the example below, the price of EURUSD drops from 1.5 to 1.22. In this case, those two levels will correspond 0% and 100%, and all fluctuations between these two points can be derived from the levels as follows: 38.2%=1.39, 50%=1.36, 61.8%=1.32.
Fibonacci retracement levels do not need the user to specify formulas for them to be calculated. When the tool is applied to a chart, you only need to select these two points, and the lines are drawn automatically at percentages of that move.
Flaws
When using the Fibonacci retracement for detecting the potential support or resistance, you should note that there are no assurances that the price will 100% stop there, so you should use the additional confirmation signals (such as the price starting to bounce off the level).
The other drawback is that there are too many levels, so the price is likely to reverse near one of them quite often, but it is difficult to predict which specific one to follow at any particular time. When it does not work out, it can always be claimed that the trader should have been following another Fibonacci retracement level instead.
Usage
The Fibonacci retracements scope is quite wide, it can be used to determine levels for placing the orders, defining the stop-loss levels, setting the price targets and more.
Example
If you have noticed the price moving upwards, then retracing to the 61.8% level, followed by going up again. As this bounce occurred at a Fibonacci level during an uptrend, it may signal a buying opportunity.
A stop loss might be set at the 61.8% level, as a return below that level could indicate that the rally has failed.
As the Fibonacci retracement price levels are static, they can be very easily identified. It helps to react wisely when the price levels are tested. These levels are inflexion points where some type of price action is expected, either a reversal or a break.
Retracement level forecasting is a technique used to identify where a retracement might occur. These retracement levels provide a good opportunity for the traders to enter new positions in the trend direction.
The Fibonacci ratios (61.8%, 38.2%, and 23.6%), help you identify the possible extent of the retracement. You can use these levels to position yourself for a trade.
In cTrader, you have a Fibonacci retracement instrument in your toolbar that allows drawing the tool on the chart, moving it and configuring depending on your needs.
You can find a detailed description of how to use it in this documentation.