Customise an indicator
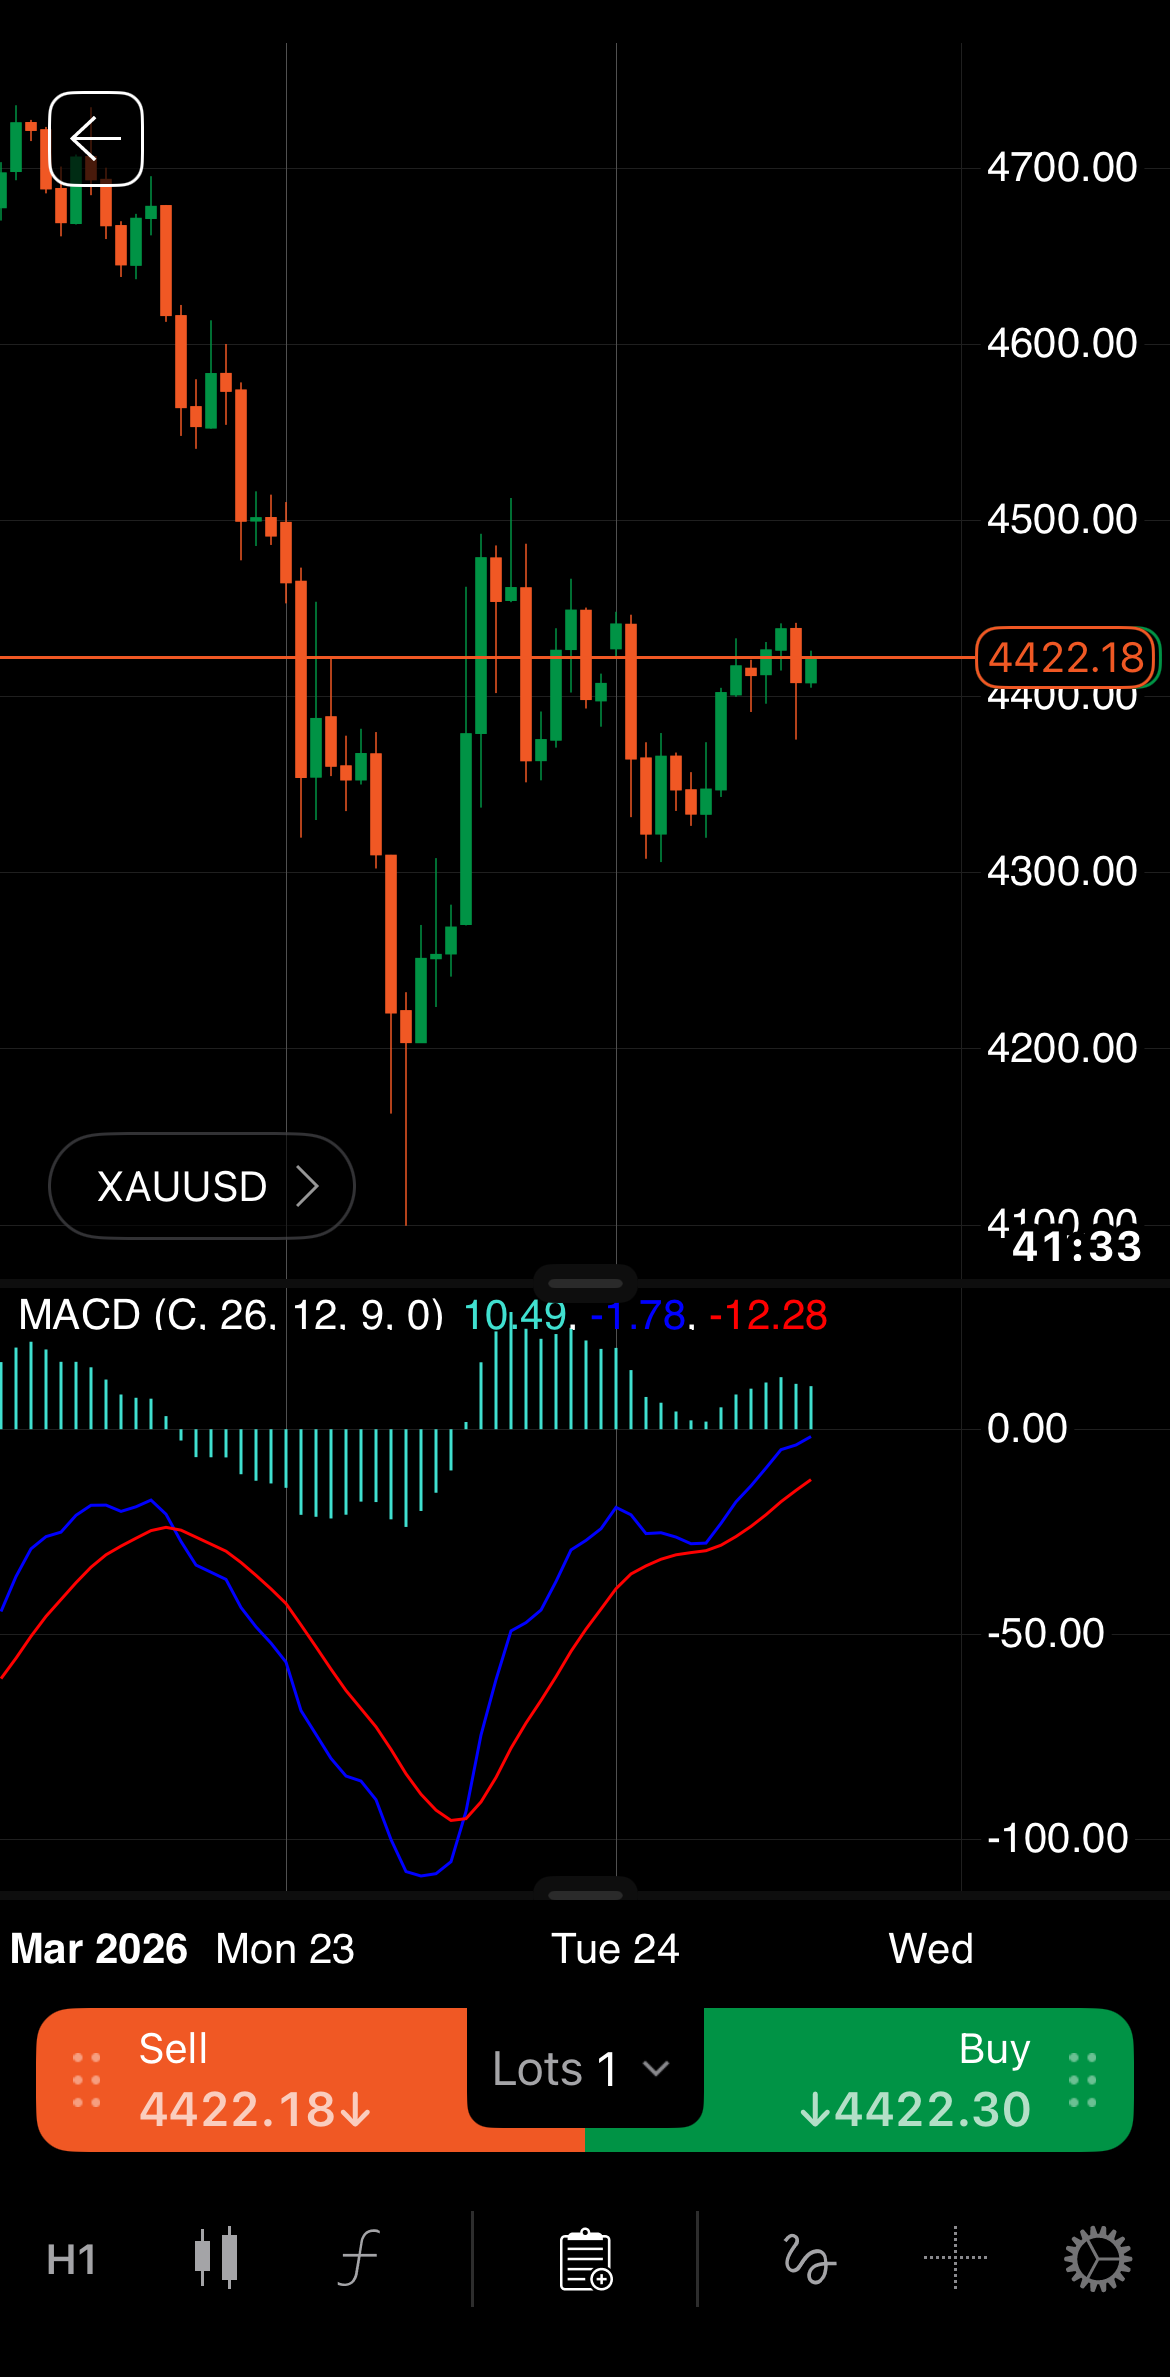
Any active indicator appears directly on the chart or in a separate panel below the chart.
The indicator's name, parameter values and output are usually visible in the top-left corner of the chart or panel. You can configure the indicator's position on the chart, its appearance and other properties.
Tap the Indicator icon at the bottom of your screen. An Indicators bottom sheet containing several controls should open.
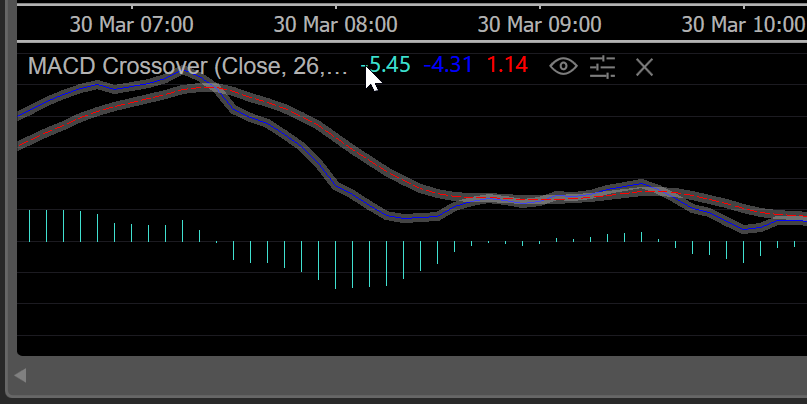
An indicator toolbar is usually visible in the top-left corner of the chart or panel. Hovering over this toolbar reveals various icons.
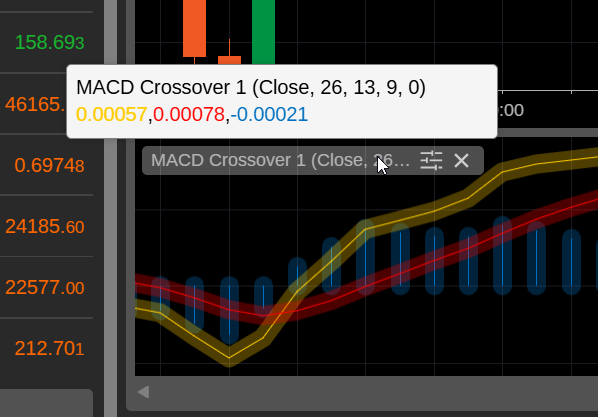
These elements are visible close to the indicator's name:
-
Parameter values – the values of the parameters or settings controlling the indicator.
-
Output – the current values of the indicator's calculations or logic.
The possible actions via icons include:
-
Properties – open the settings window for the indicator.
-
Close indicator – delete the indicator from the chart. For an indicator in a separate panel, this action removes the entire panel.
Settings window
The a settings window for an indicator, accessible by clicking the Properties icon, offers various options for controlling and customising an active indicator.
A toolbar for the indicator is usually visible in the top-left corner of the chart or panel. Hovering over this toolbar reveals various icons.
These elements are visible to the right of the indicator's name:
-
Parameter values – the values of the parameters or settings controlling the indicator.
Note
Custom indicators are not limited to preset parameters.
-
Output – the current values of the indicator's calculations or logic.
The possible actions via icons include:
-
Hide/Show – hide or show the indicator on the chart.
-
Properties – open the settings window for the indicator.
-
Learn more – open a tutorial where you can learn more about the indicator in your browser.
-
Close indicator – delete the indicator from the chart. For an indicator alone in a separate panel, this action removes the entire panel.
Settings window
The settings window for an indicator, accessible by clicking the Properties icon, offers various options for controlling and customising an active indicator.
A toolbar for the indicator is usually visible in the top-left corner of the chart or panel. Hovering over this toolbar reveals various icons.
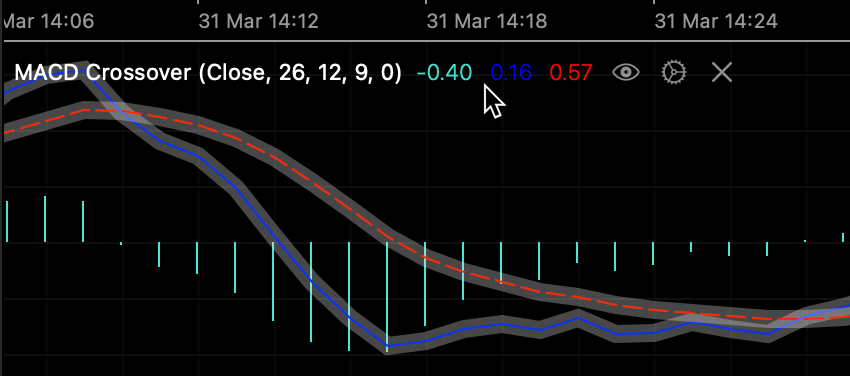
These elements are visible to the right of the indicator's name:
-
Parameter values – the values of the parameters or settings controlling the indicator.
Note
Custom indicators are not limited to preset parameters.
-
Output – the current values of the indicator's calculations or logic.
The possible actions via icons include:
-
Hide/Show – hide or show the indicator on the chart.
-
Properties – open the settings window for the indicator.
-
Learn more – open a tutorial where you can learn more about the indicator in your browser.
-
Close indicator – delete the indicator from the chart. For an indicator in a separate panel, this action removes the entire panel.
Settings window
The settings window for an indicator, accessible by clicking the Properties icon, offers various options for controlling and customising an active indicator.
Set the position
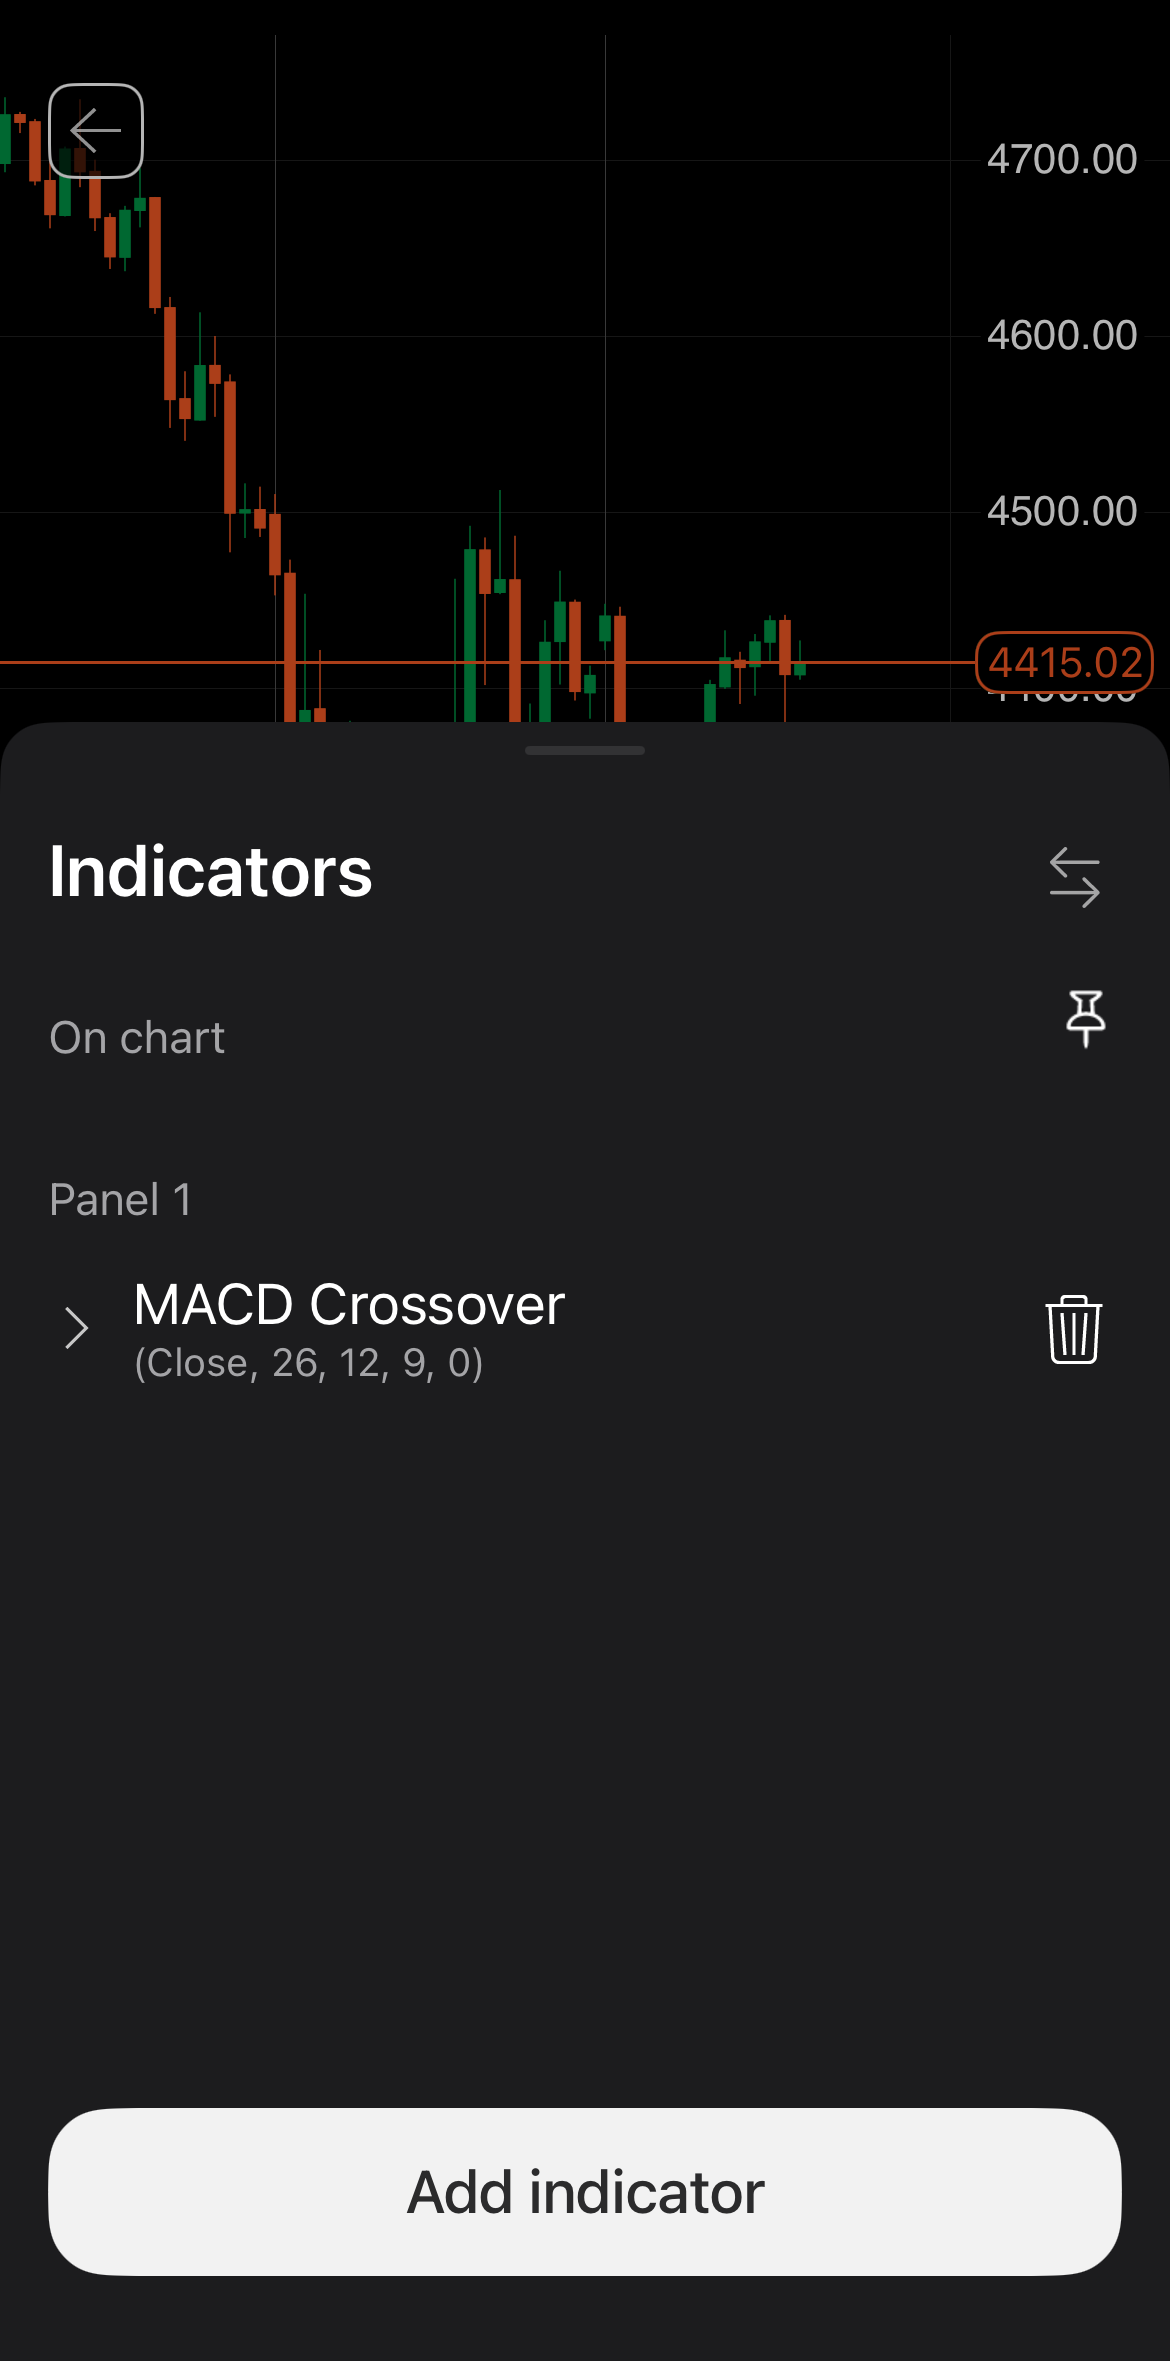
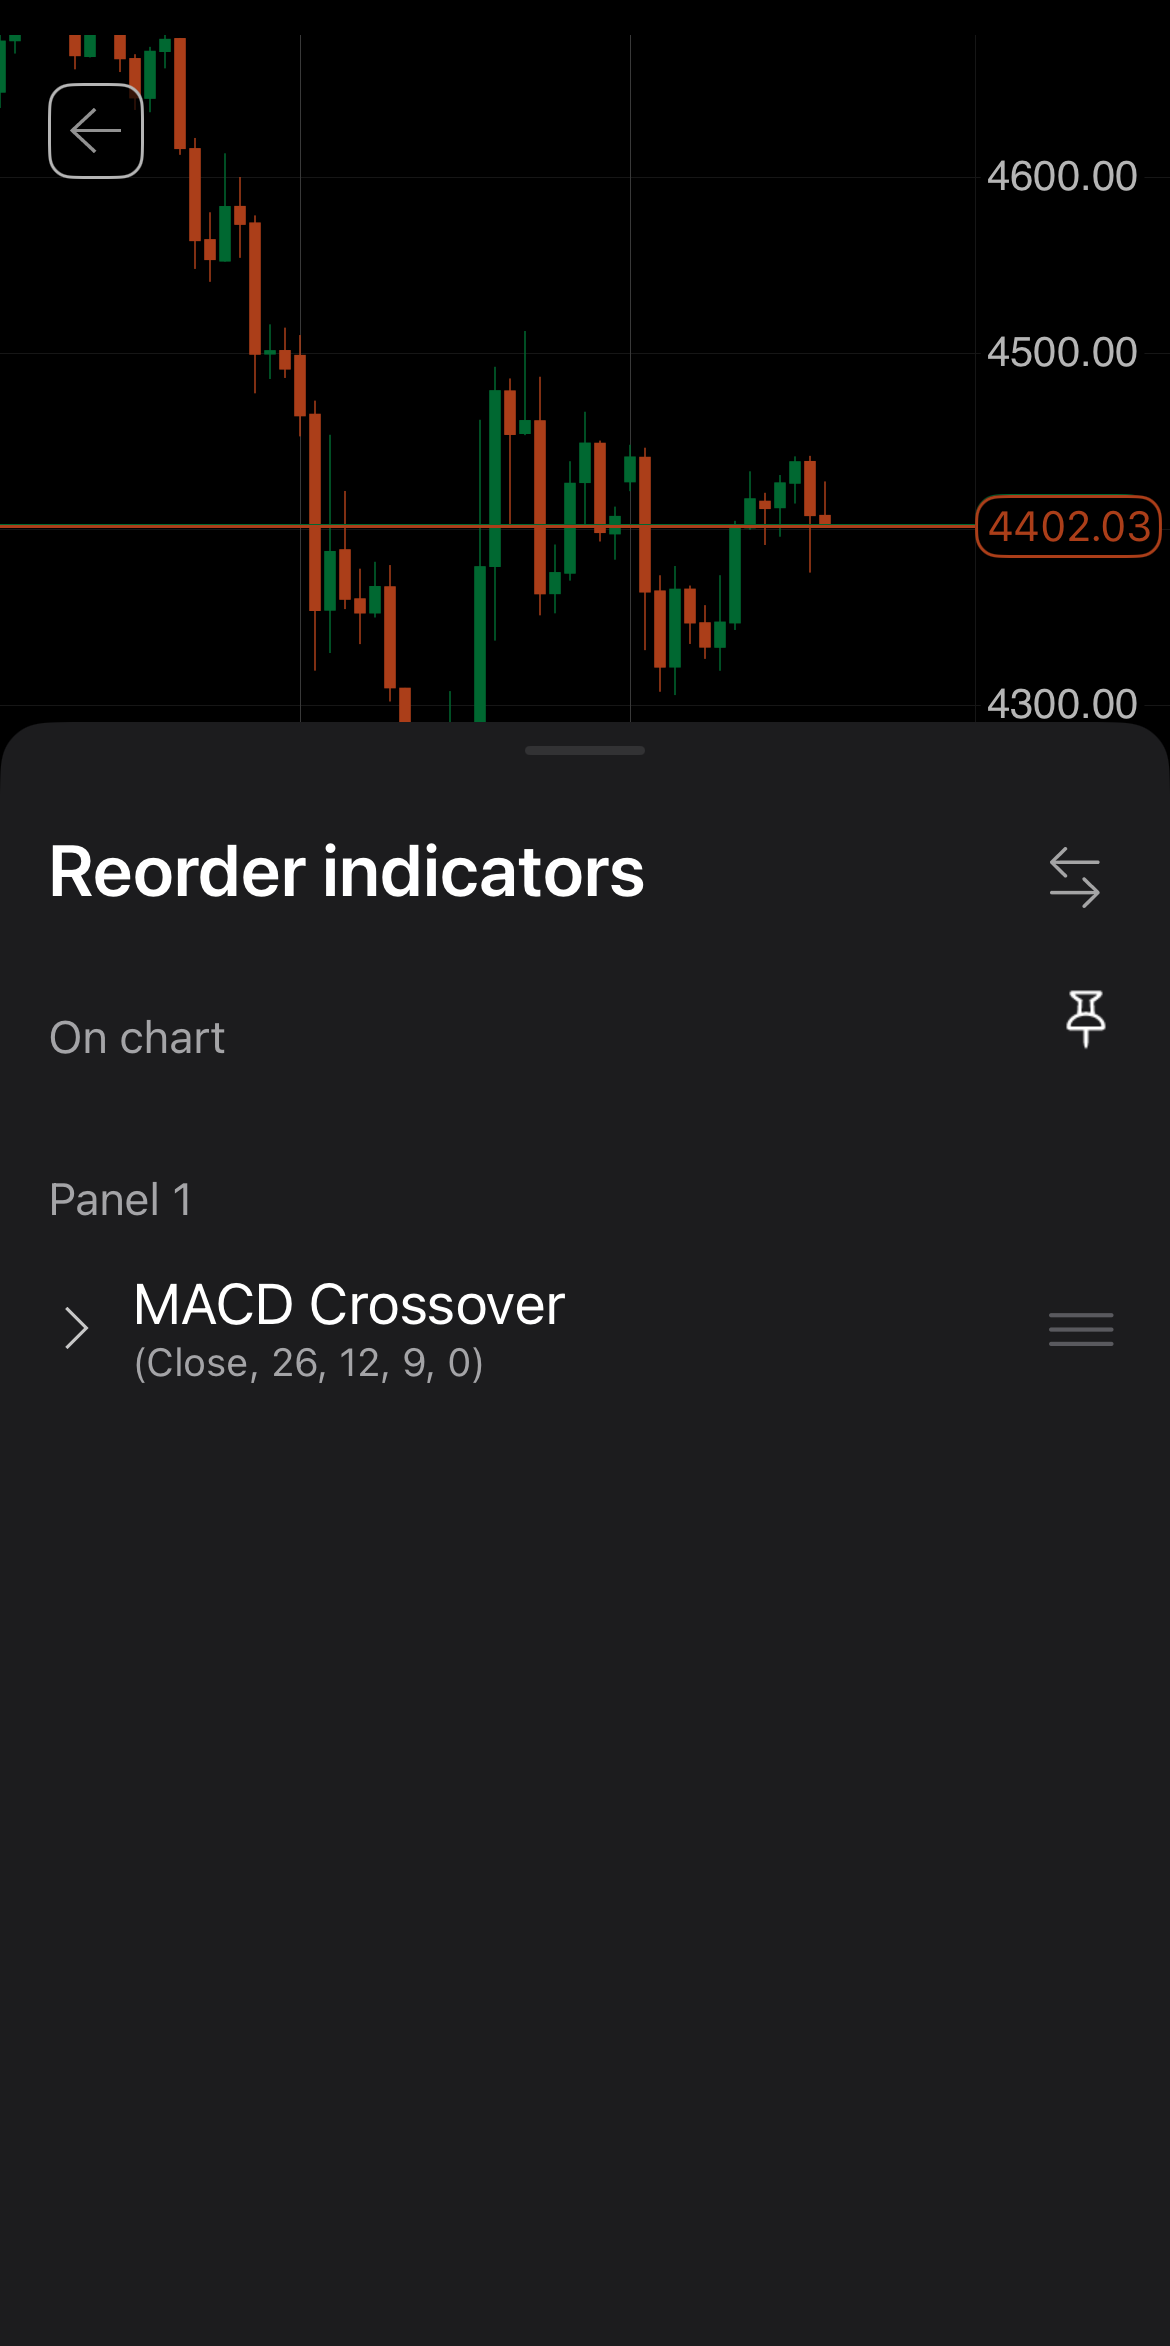
Tap the Reorder icon in the top-right corner of the bottom sheet. Drag the indicator control up or down, dropping it in the On chart or Panel area to specify its position.
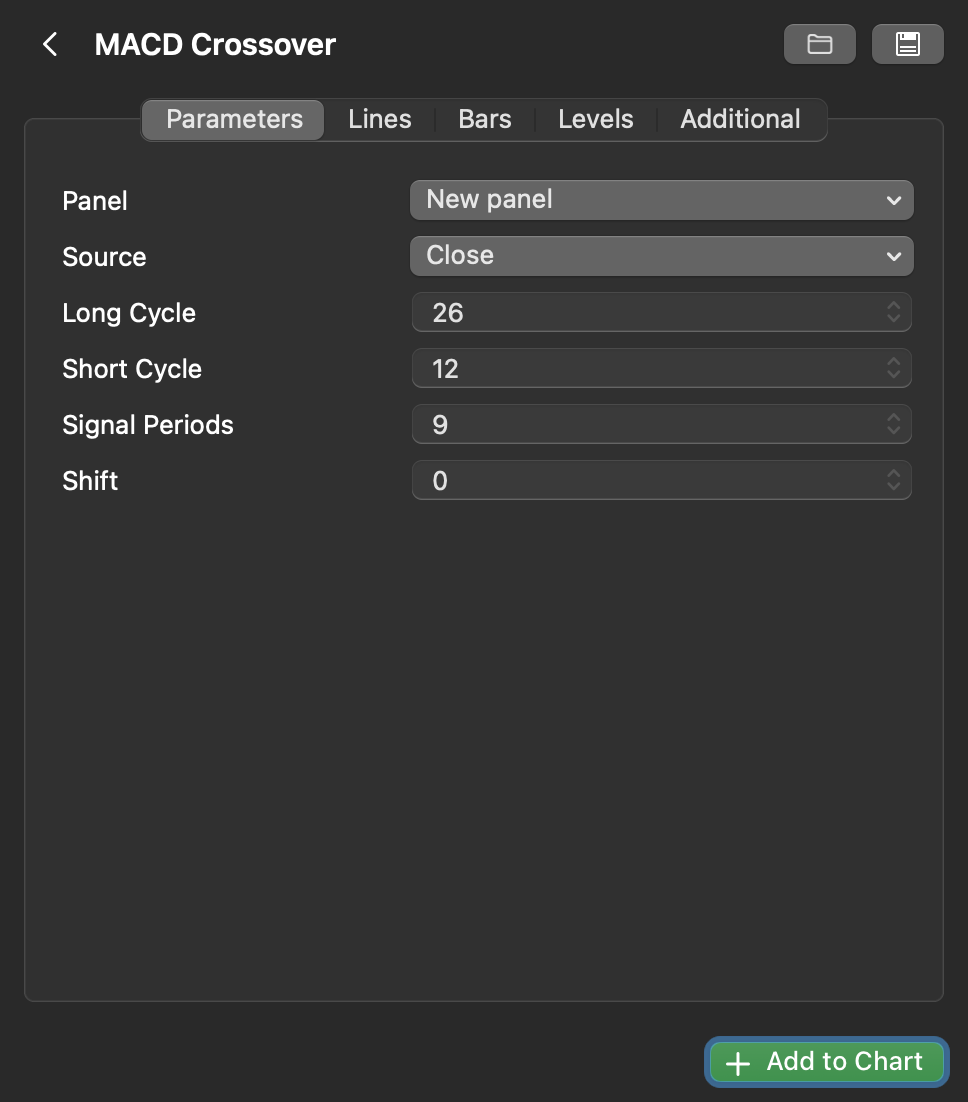
In the indicator's settings windows, click the Panel drop-down. The available options are:
-
On chart – display the indicator drawings directly on the chart.
-
Panel – display the indicator drawings in a separate panel below the chart.
In the indicator's settings windows, click the Panel drop-down. The available options are:
-
On chart – display the indicator drawings directly on the chart.
-
Panel – display the indicator drawings in a separate panel below the chart.
In the indicator's settings windows, click the Panel drop-down. The available options are:
-
On chart – display the indicator drawings directly on the chart.
-
Panel – display the indicator drawings in a separate panel below the chart.
Configure properties
The available options depend on the indicator.
Tapping the indicator in the bottom sheet reveals an expanded menu. Here, you can specify your preferred values for parameters that determine the indicator's output and define its appearance.
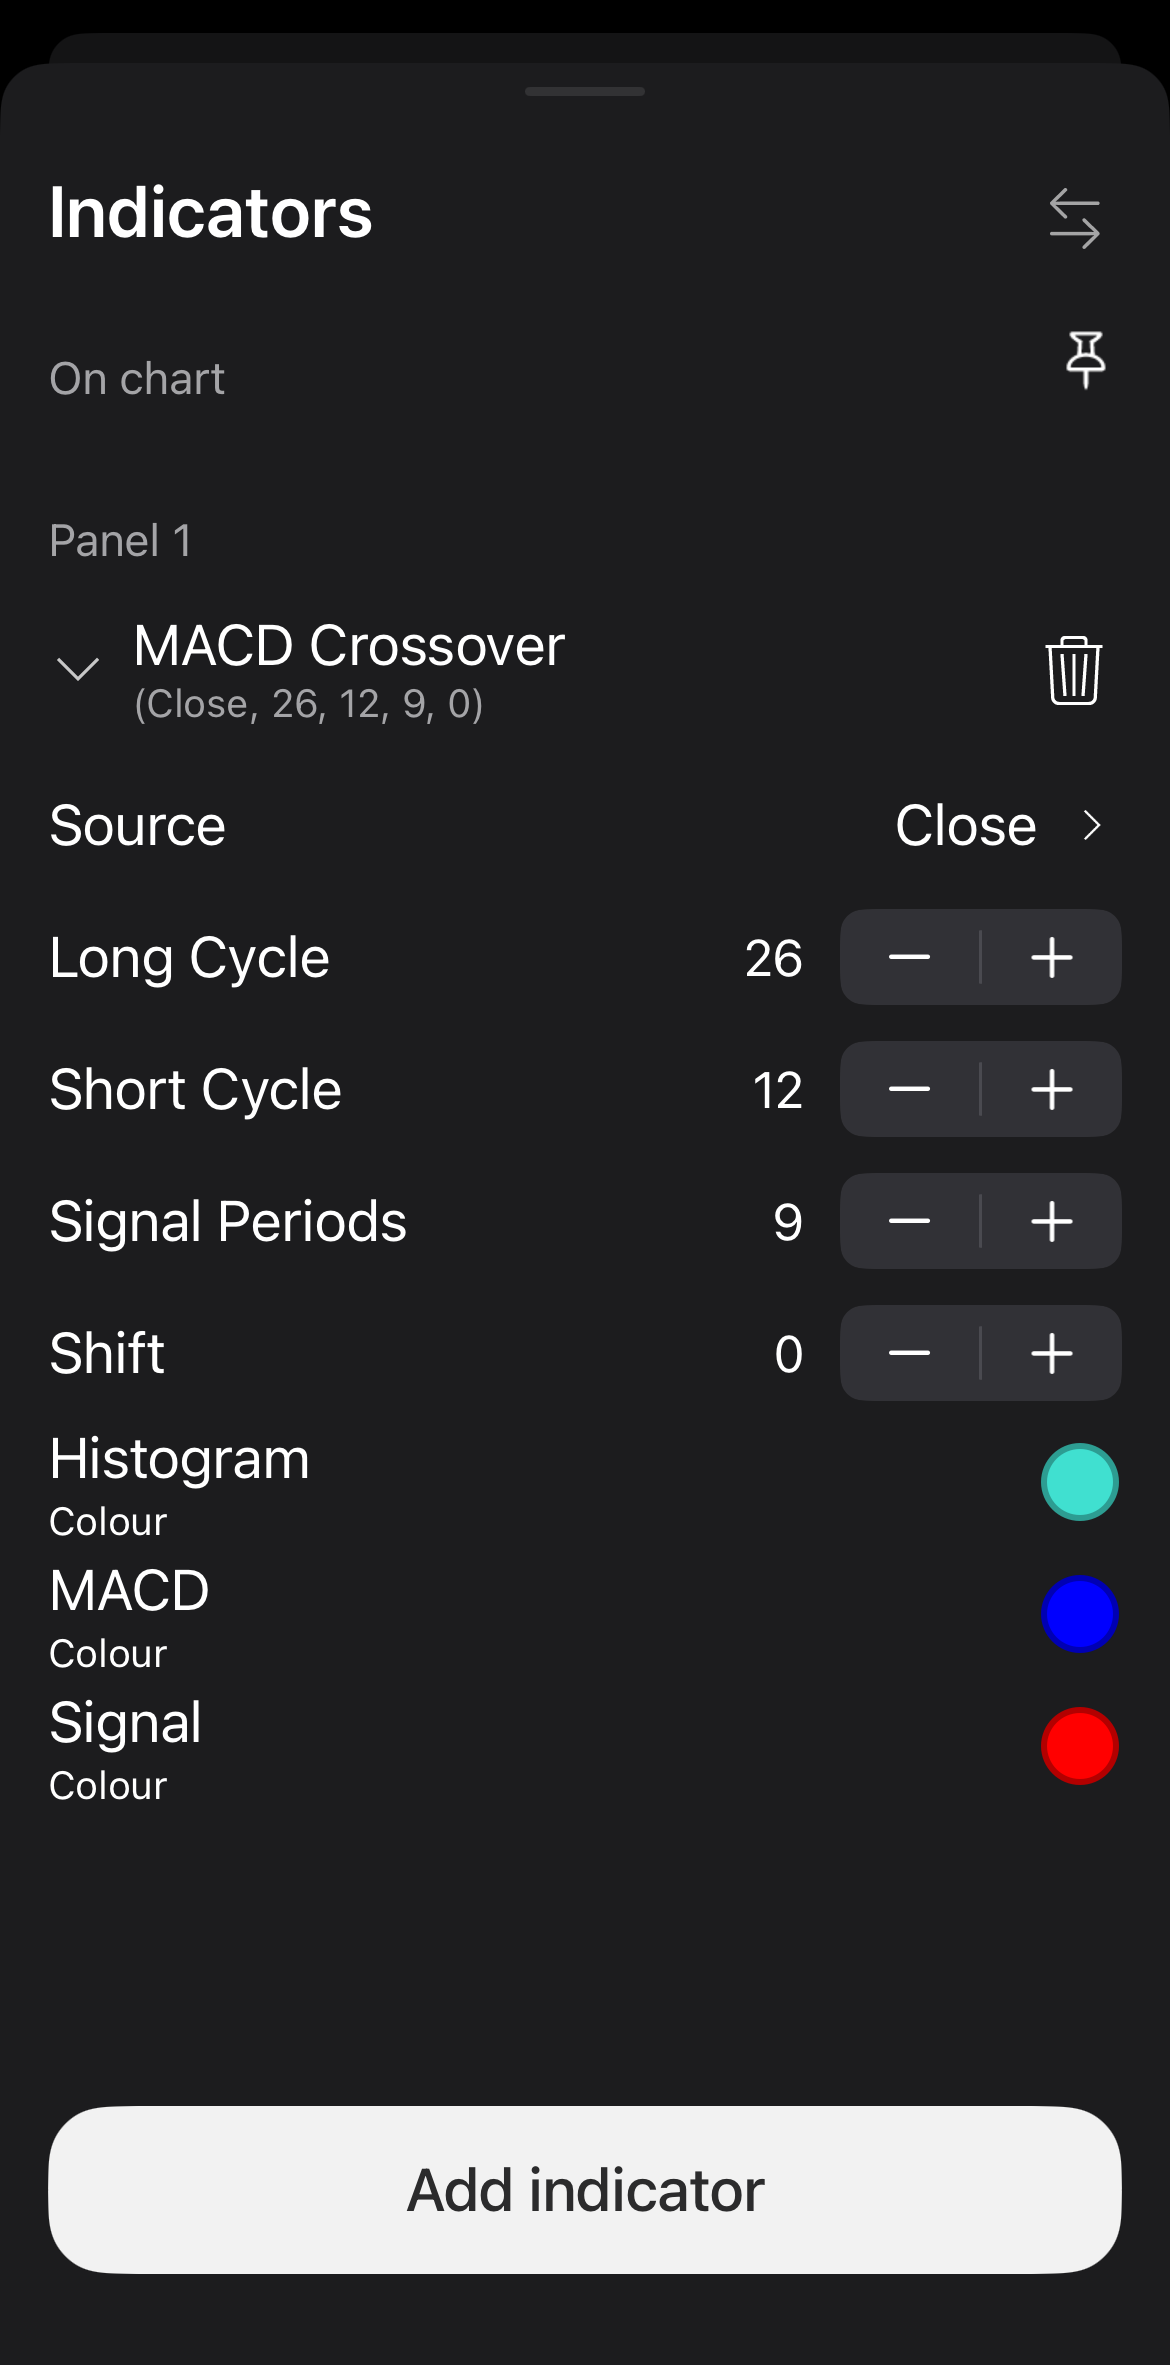
For example, the built-in MACD Crossover indicator allows you to:
- choose a specific data source for building the indicator
- set values for long cycle, short cycle, signal periods and shift
- specify the colours for each line
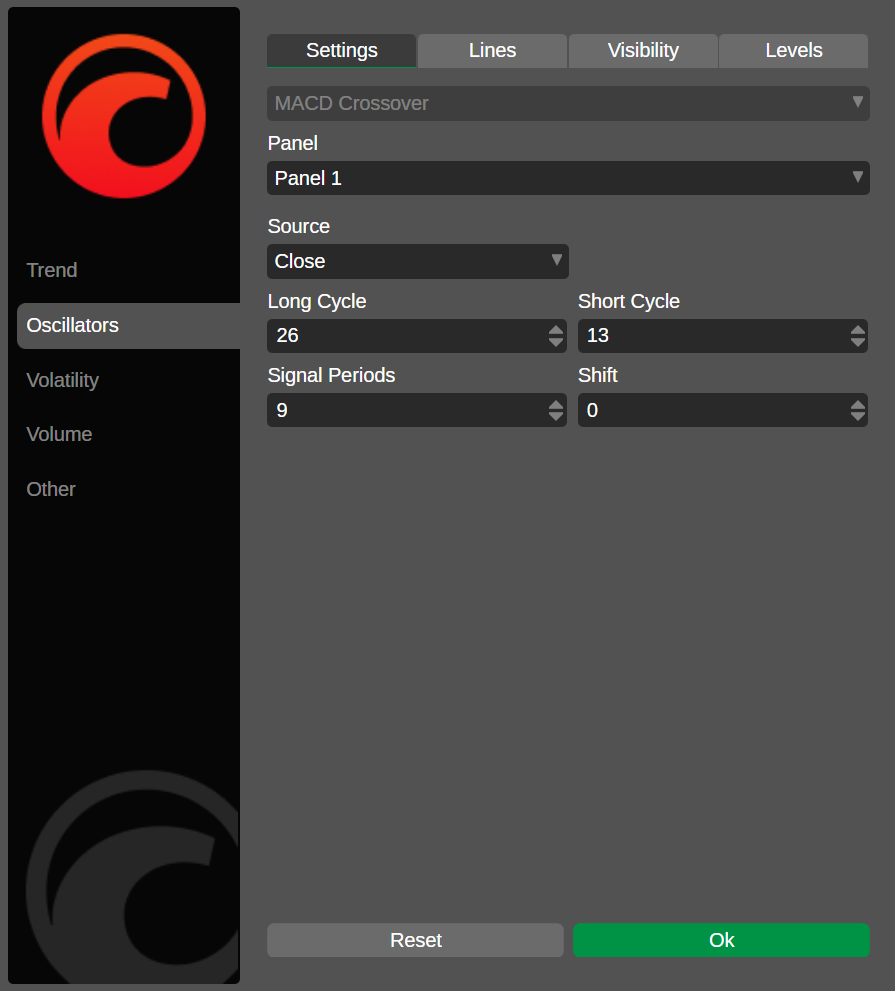
In the indicator's settings windows, you can specify your preferred values for parameters that determine the indicator's output. For example, the built-in MACD Crossover indicator allows you to choose a data source and configure its long cycle, short cycle, signal periods and shift.
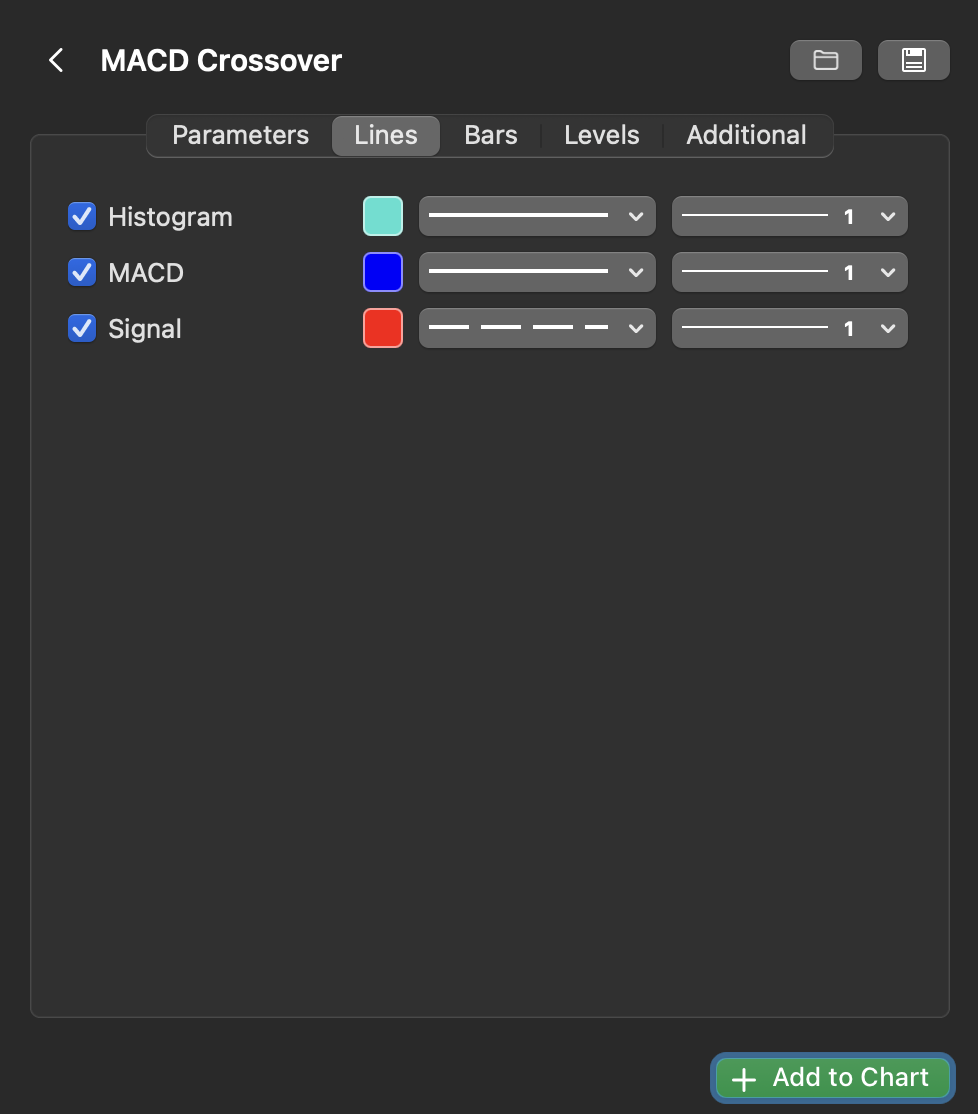
In the Lines tab, you can do the following for each available line:
- enable or disable it
- choose a line type
- set the line thickness
- choose the line colour
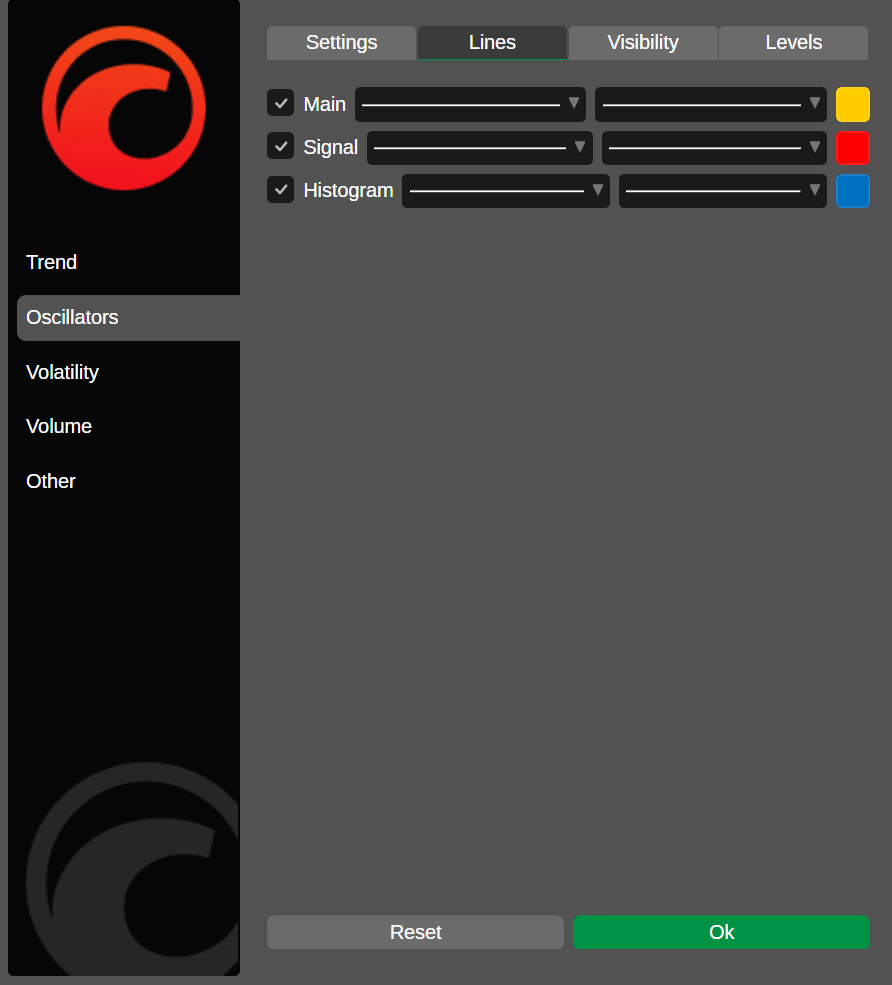
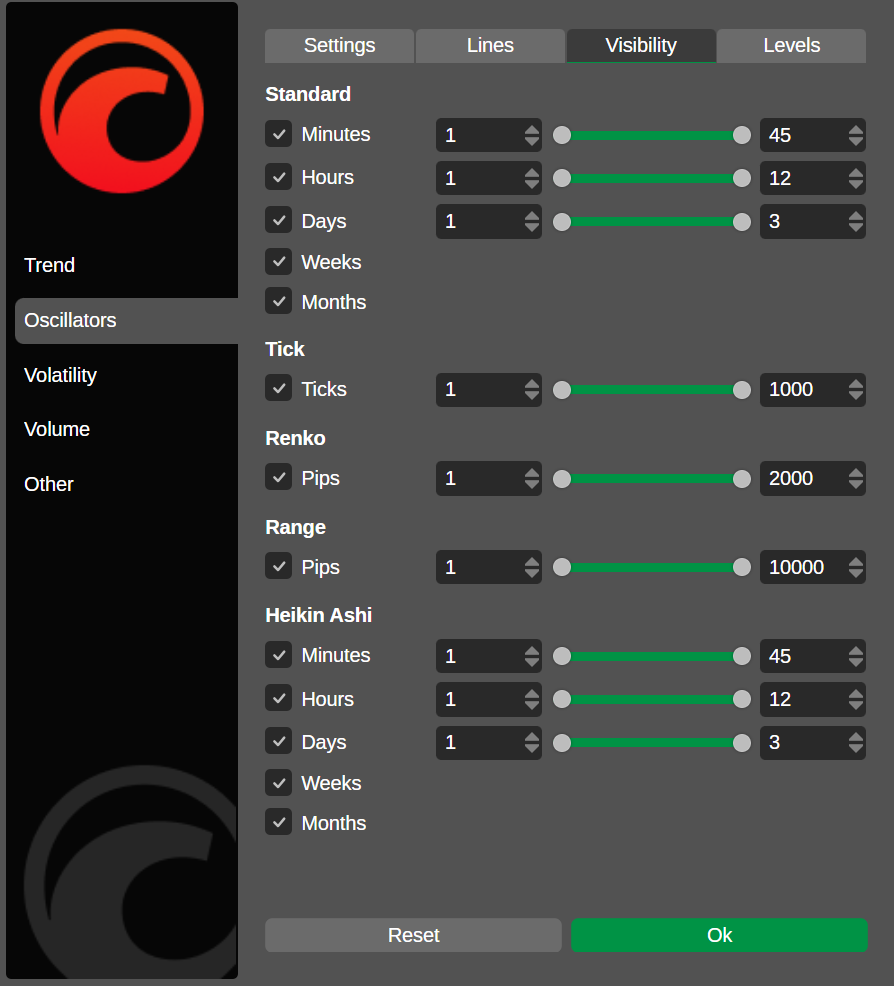
In the Visibility tab, you can choose periods and specify ranges for which the indicator should be visible.
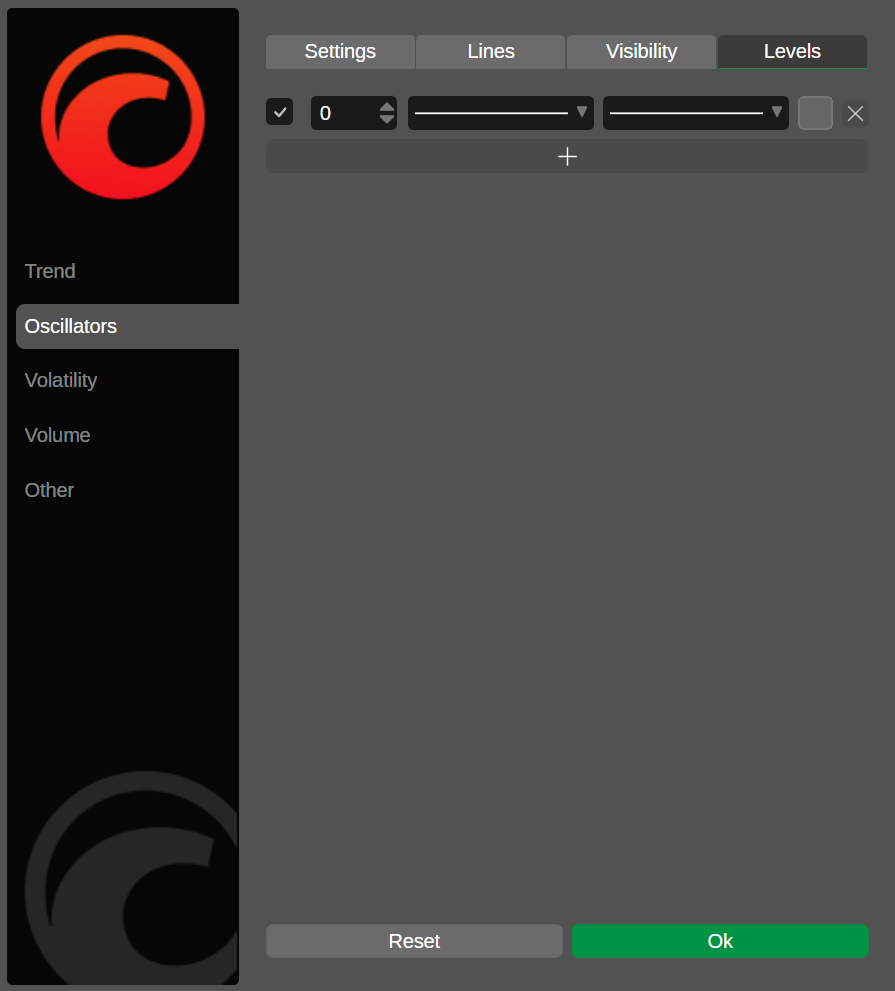
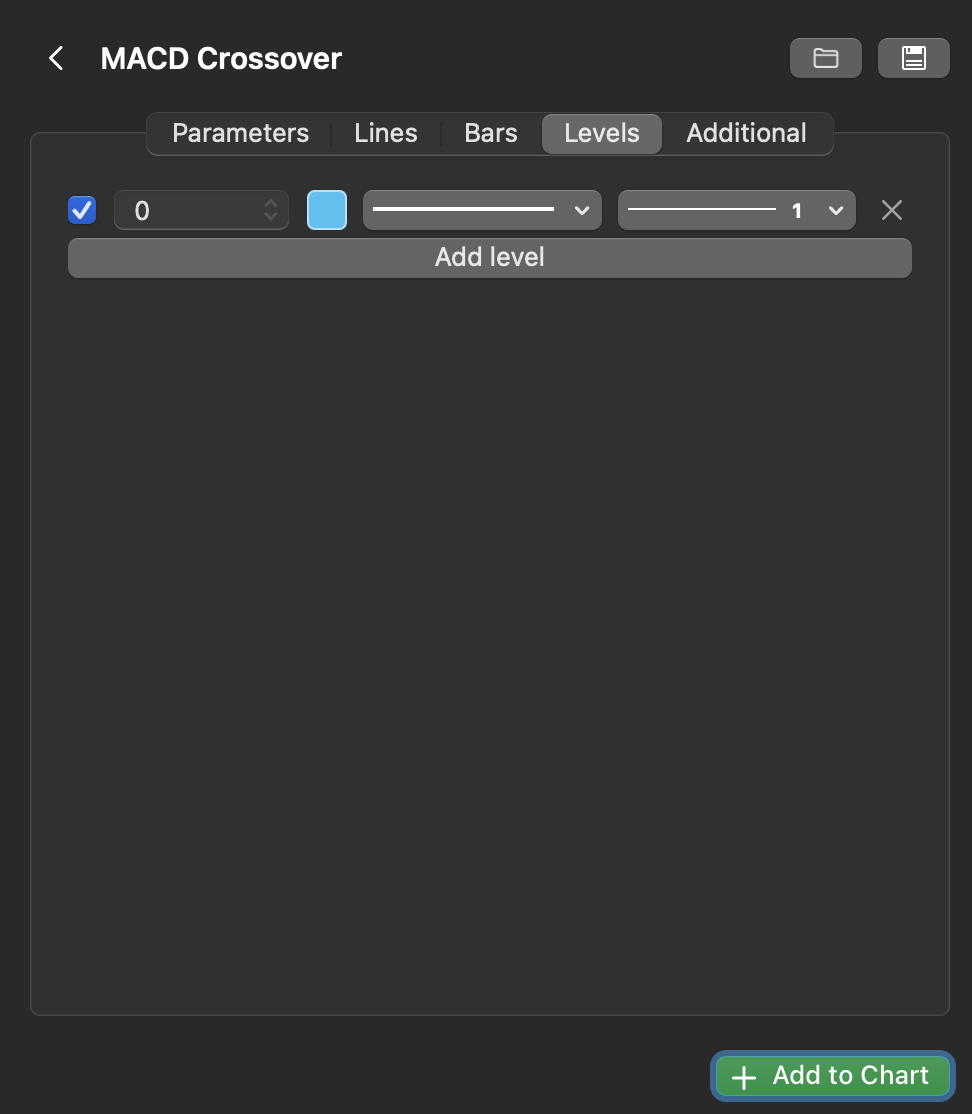
In the Levels tab, you can:
- add a new level line or remove an existing one
- enable or disable a level line
- choose a line type for each level line
- set the line thickness for each level line
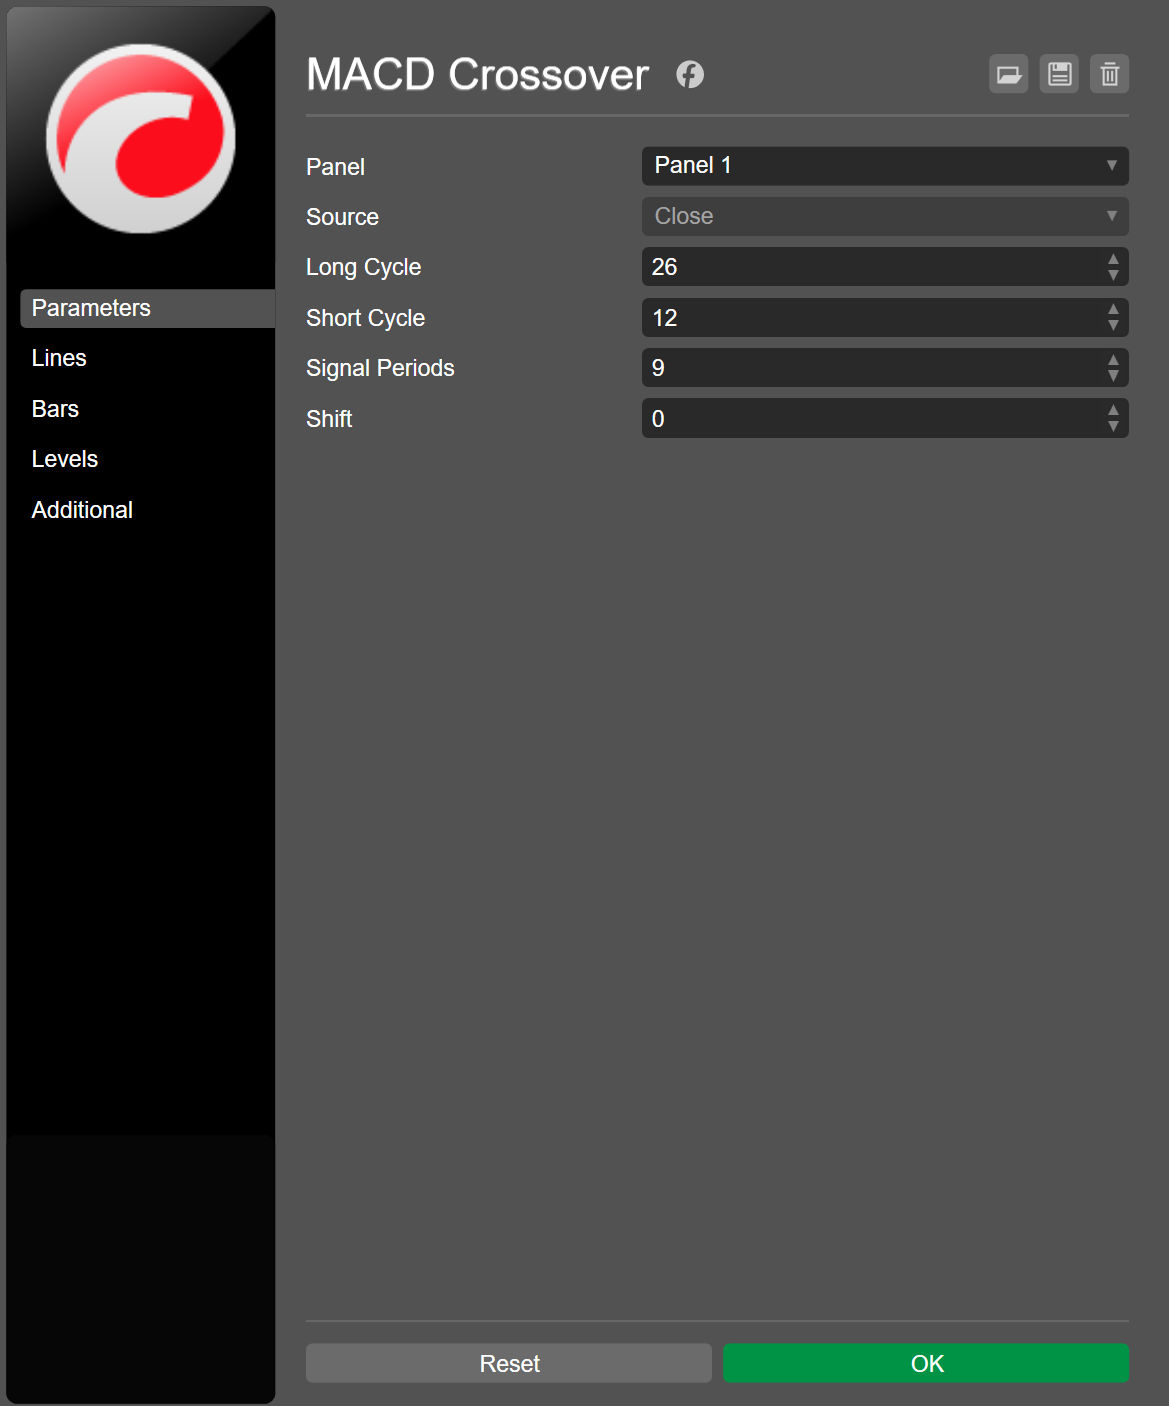
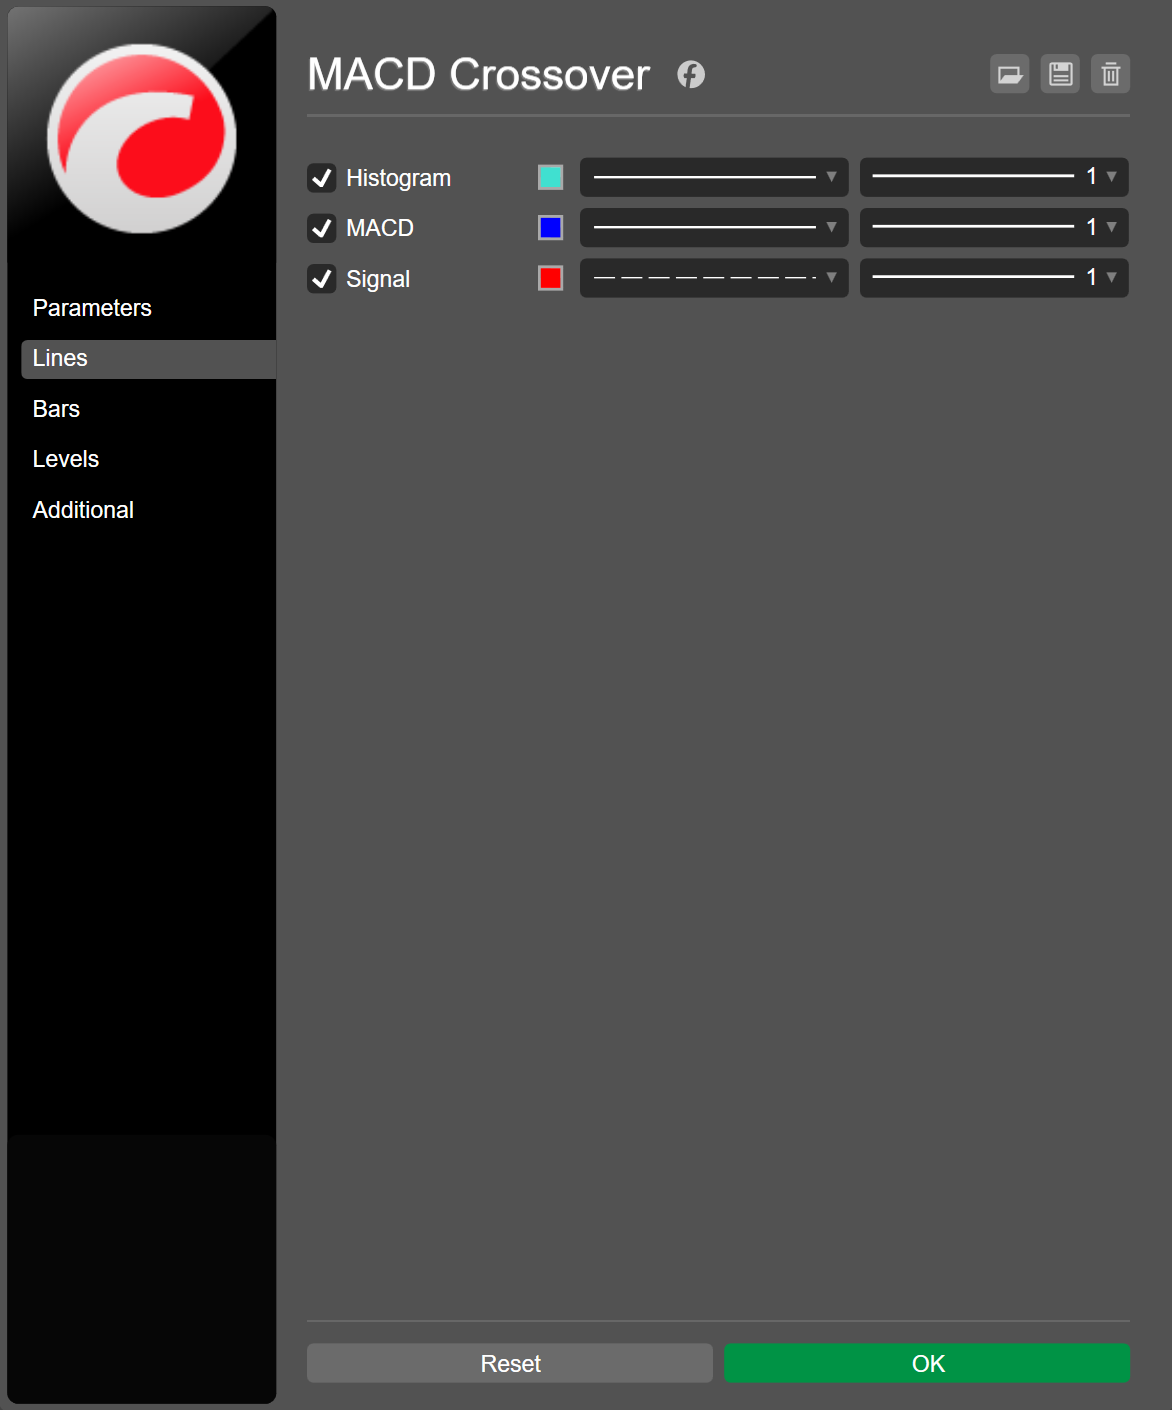
In the Parameters tab of the indicator's settings windows, you can specify your preferred values for parameters that determine the indicator's output. For example, the built-in MACD Crossover indicator allows you to configure its long cycle, short cycle, signal periods and shift.
In the Lines tab, you can do the following for each available line:
- enable or disable it
- choose a line type
- set the thickness
- select a colour
In the Bars tab, you can specify the settings for bars, if available.
In the Levels tab, you can add a new level line, remove an existing line and also do the following for each line:
- enable or disable it
- specify a value
- choose a line type
- set the thickness
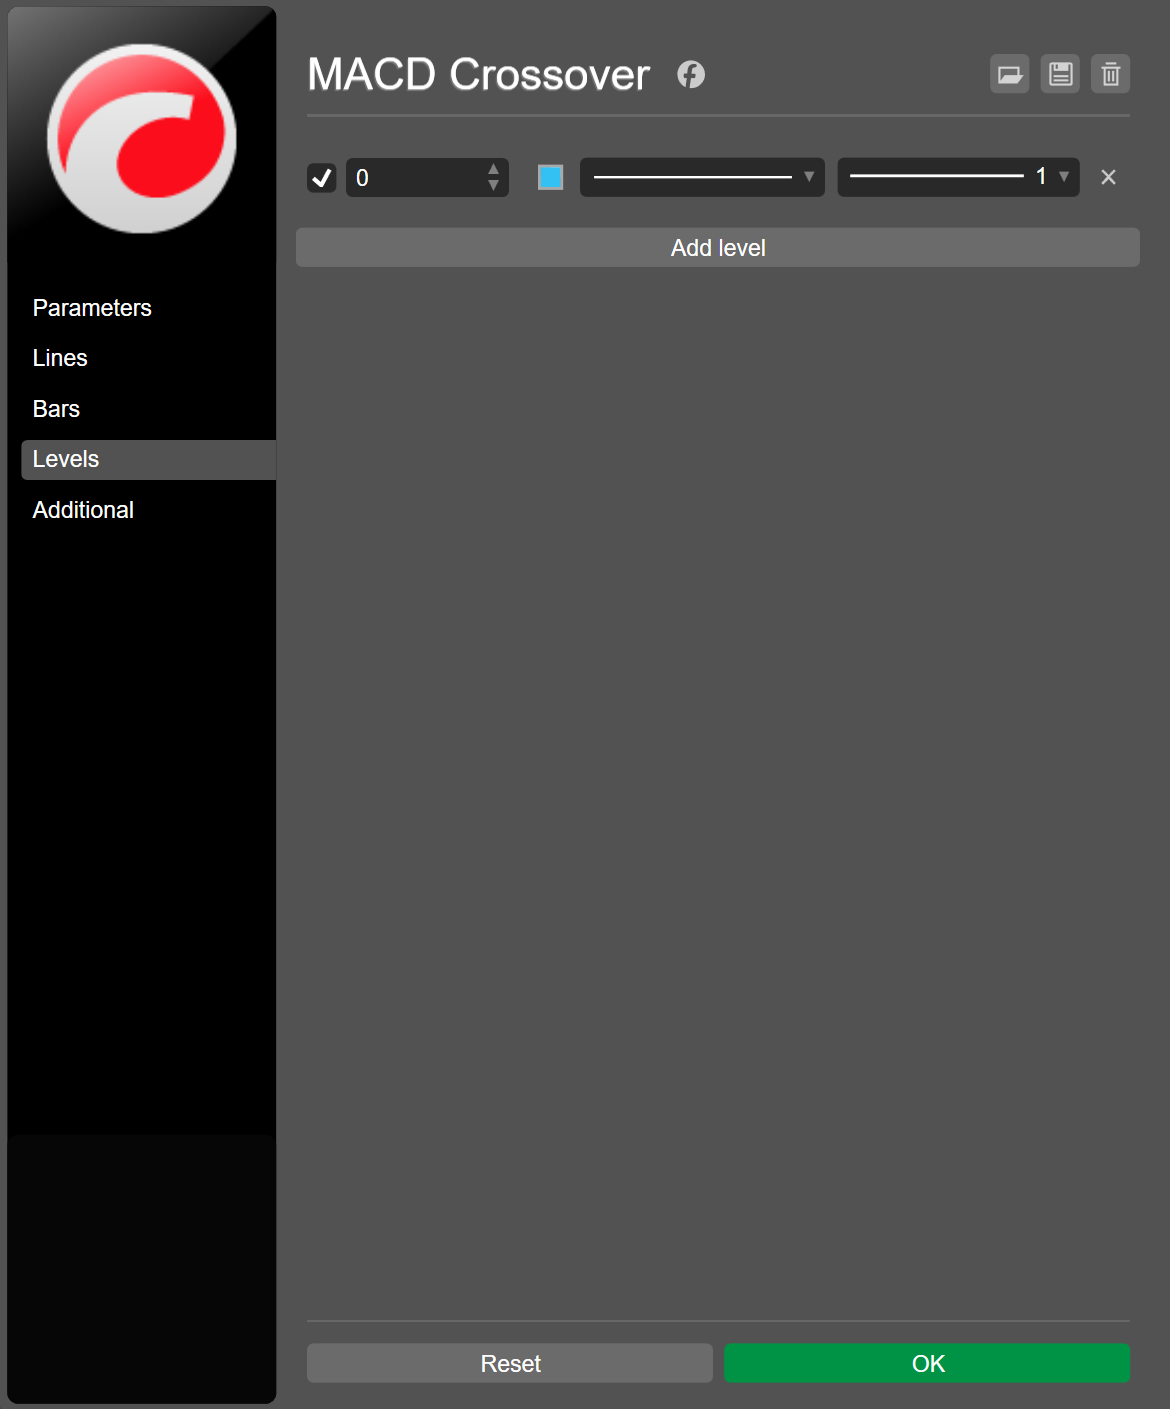
In the Additional tab, you can change the name of the indicator instance.
In the Parameters tab of the indicator's settings windows, you can specify your preferred values for parameters that determine the indicator's output. For example, the built-in MACD Crossover indicator allows you to configure its long cycle, short cycle, signal periods and shift.
In the Lines tab, you can do the following for each available line:
- enable or disable
- choose a line type
- set the thickness
- select a colour
In the Bars tab, you can specify the settings for bars, if available.
In the Levels tab, you can add a new level line, remove an existing line and also do the following for each line:
- enable or disable
- choose a line type
- set the thickness
In the Additional tab, you can change the name of the indicator instance.
Use the object manager
In cTrader Web, Windows and Mac, the object manager of a chart allows you to manage all its active indicators from a single location.
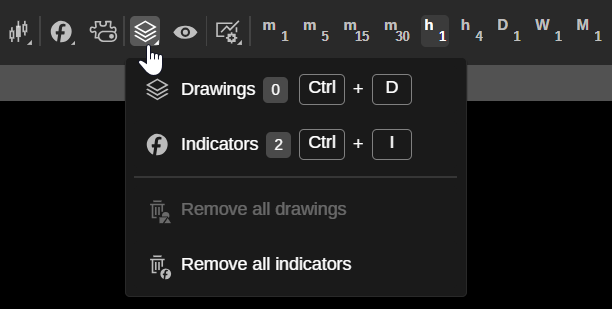
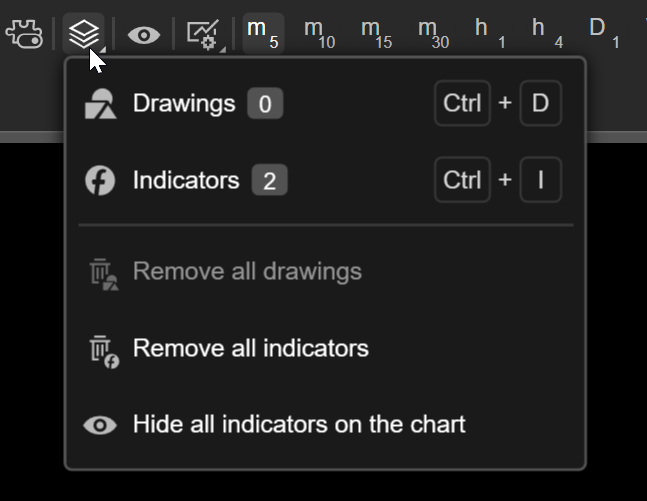
Click the Object manager icon in the chart toolbar and select Indicators, or press Ctrl+I.
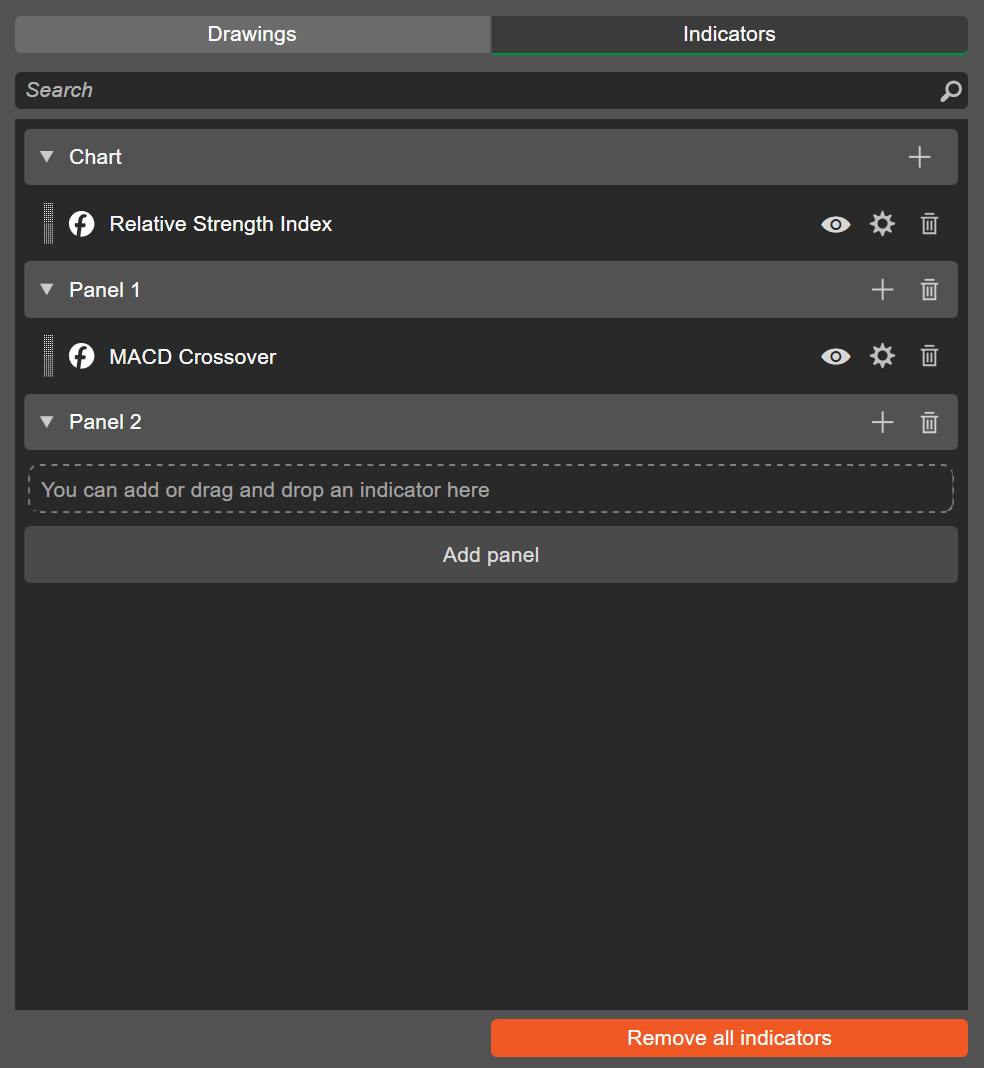
The Indicators tab of the object manager should open.
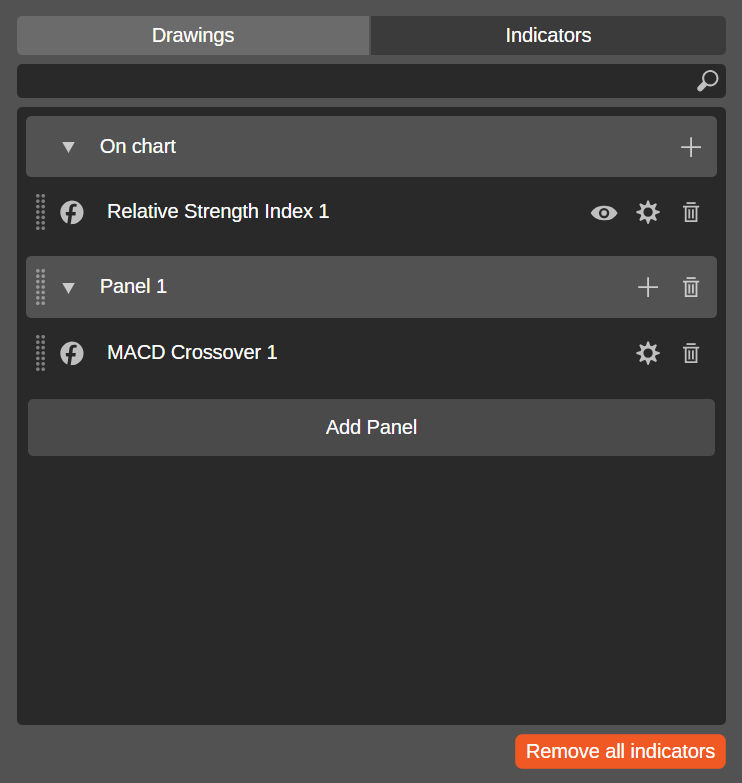
The search field allows you to quickly find an active indicator. Clicking the Add indicator icon to the right of On chart or Panel reveals a menu for selecting an indicator.
You can drag the control to the left of each indicator to move the indicator to a chart, a separate panel or across both. The icons to the right of an indicator include:
-
Visibility – hide or show the indicator drawings on the chart.
-
Settings – open the indicator's settings windows where you can specify its parameters, line colours and other properties.
-
Remove – delete the indicator from the chart.
Clicking Add panel adds a new panel to the list, while clicking the Remove all indicators button deletes all indicators from the chart at once.
Click the Object manager icon in the chart toolbar and select Indicators, or press Ctrl+I.
The Indicators tab of the object manager should open.
The search field allows you to quickly find an active indicator. Clicking the Add indicator icon to the right of Chart or Panel reveals a menu for selecting an indicator.
You can drag the control to the left of each indicator to move the indicator to a chart, a separate panel or across both. The icons to the right of an indicator include:
-
Hide/Show object – hide or show the indicator drawings on the chart.
-
Settings – open the indicator's settings windows where you can specify its parameters, line colours and other properties.
-
Remove – delete the indicator from the chart.
Clicking Add panel adds a new panel to the list, while clicking the Remove all indicators button deletes all indicators from the chart at once.
Click the Object manager icon in the chart toolbar and select Indicators, or press Cmd+I.
![]()
The Indicators tab of the object manager should open.
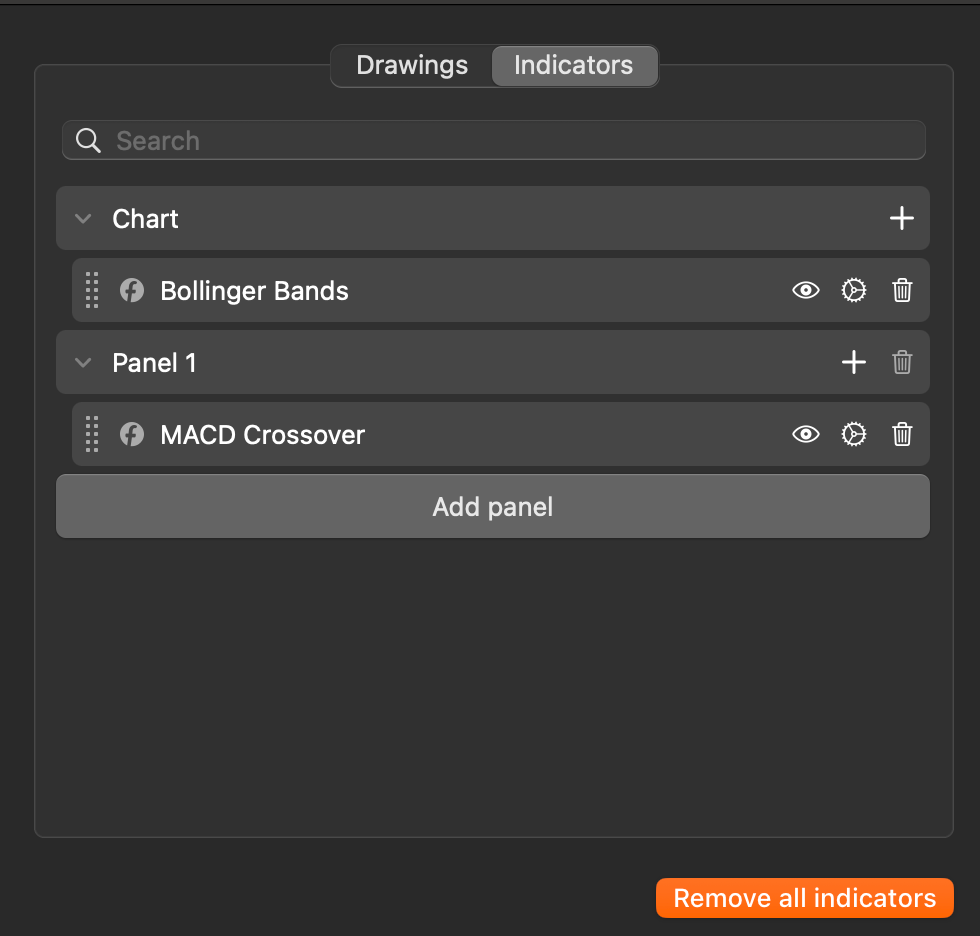
The search field allows you to quickly find an active indicator. Clicking the Add indicator icon to the right of Chart or Panel reveals a menu for selecting an indicator.
You can drag the control to the left of each indicator to move the indicator to a chart, a separate panel or across both. The icons to the right of an indicator include:
-
Hide/Show object – hide or show the indicator drawings on the chart.
-
Settings – open the indicator's settings windows where you can specify its parameters, line colours and other properties.
-
Remove – delete the indicator from the chart.
Clicking Add panel adds a new panel to the list, while clicking the Remove all indicators button deletes all indicators from the chart at once.